Norwegian vs Yaqui Child Poverty Among Boys Under 16
COMPARE
Norwegian
Yaqui
Child Poverty Among Boys Under 16
Child Poverty Among Boys Under 16 Comparison
Norwegians
Yaqui
13.2%
CHILD POVERTY AMONG BOYS UNDER 16
99.9/ 100
METRIC RATING
17th/ 347
METRIC RANK
20.7%
CHILD POVERTY AMONG BOYS UNDER 16
0.0/ 100
METRIC RATING
292nd/ 347
METRIC RANK
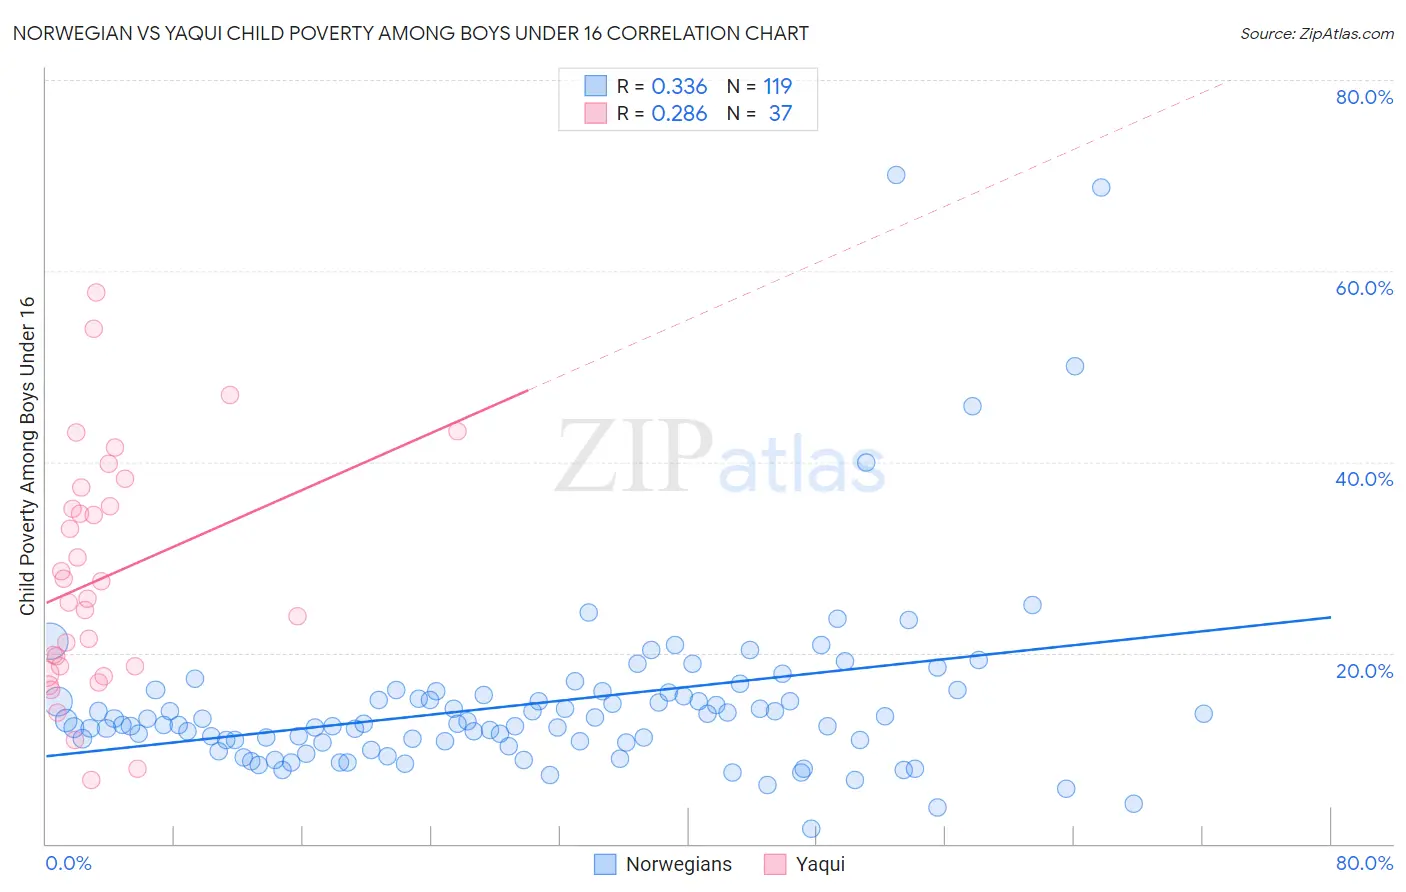
Norwegian vs Yaqui Child Poverty Among Boys Under 16 Correlation Chart
The statistical analysis conducted on geographies consisting of 516,210,620 people shows a mild positive correlation between the proportion of Norwegians and poverty level among boys under the age of 16 in the United States with a correlation coefficient (R) of 0.336 and weighted average of 13.2%. Similarly, the statistical analysis conducted on geographies consisting of 107,428,472 people shows a weak positive correlation between the proportion of Yaqui and poverty level among boys under the age of 16 in the United States with a correlation coefficient (R) of 0.286 and weighted average of 20.7%, a difference of 57.0%.
Child Poverty Among Boys Under 16 Correlation Summary
| Measurement | Norwegian | Yaqui |
| Minimum | 1.6% | 6.7% |
| Maximum | 70.0% | 57.8% |
| Range | 68.4% | 51.1% |
| Mean | 14.7% | 27.9% |
| Median | 12.6% | 25.7% |
| Interquartile 25% (IQ1) | 10.6% | 18.2% |
| Interquartile 75% (IQ3) | 15.6% | 36.3% |
| Interquartile Range (IQR) | 4.9% | 18.1% |
| Standard Deviation (Sample) | 9.8% | 12.4% |
| Standard Deviation (Population) | 9.7% | 12.2% |
Similar Demographics by Child Poverty Among Boys Under 16
Demographics Similar to Norwegians by Child Poverty Among Boys Under 16
In terms of child poverty among boys under 16, the demographic groups most similar to Norwegians are Maltese (13.2%, a difference of 0.090%), Immigrants from Japan (13.1%, a difference of 0.41%), Immigrants from Ireland (13.1%, a difference of 0.51%), Bulgarian (13.3%, a difference of 0.53%), and Bolivian (13.3%, a difference of 0.59%).
| Demographics | Rating | Rank | Child Poverty Among Boys Under 16 |
| Bhutanese | 100.0 /100 | #10 | Exceptional 12.6% |
| Immigrants | South Central Asia | 100.0 /100 | #11 | Exceptional 12.7% |
| Burmese | 99.9 /100 | #12 | Exceptional 13.0% |
| Immigrants | Korea | 99.9 /100 | #13 | Exceptional 13.0% |
| Immigrants | Ireland | 99.9 /100 | #14 | Exceptional 13.1% |
| Immigrants | Japan | 99.9 /100 | #15 | Exceptional 13.1% |
| Maltese | 99.9 /100 | #16 | Exceptional 13.2% |
| Norwegians | 99.9 /100 | #17 | Exceptional 13.2% |
| Bulgarians | 99.9 /100 | #18 | Exceptional 13.3% |
| Bolivians | 99.9 /100 | #19 | Exceptional 13.3% |
| Indians (Asian) | 99.9 /100 | #20 | Exceptional 13.3% |
| Immigrants | Eastern Asia | 99.9 /100 | #21 | Exceptional 13.3% |
| Tongans | 99.9 /100 | #22 | Exceptional 13.4% |
| Latvians | 99.9 /100 | #23 | Exceptional 13.4% |
| Immigrants | Lithuania | 99.8 /100 | #24 | Exceptional 13.5% |
Demographics Similar to Yaqui by Child Poverty Among Boys Under 16
In terms of child poverty among boys under 16, the demographic groups most similar to Yaqui are Immigrants from Senegal (20.7%, a difference of 0.010%), Immigrants from Bahamas (20.7%, a difference of 0.13%), Mexican (20.7%, a difference of 0.25%), Immigrants from Latin America (20.6%, a difference of 0.26%), and Indonesian (20.8%, a difference of 0.45%).
| Demographics | Rating | Rank | Child Poverty Among Boys Under 16 |
| Arapaho | 0.0 /100 | #285 | Tragic 20.2% |
| West Indians | 0.0 /100 | #286 | Tragic 20.3% |
| Immigrants | Belize | 0.0 /100 | #287 | Tragic 20.3% |
| Immigrants | St. Vincent and the Grenadines | 0.0 /100 | #288 | Tragic 20.3% |
| Blackfeet | 0.0 /100 | #289 | Tragic 20.4% |
| Senegalese | 0.0 /100 | #290 | Tragic 20.6% |
| Immigrants | Latin America | 0.0 /100 | #291 | Tragic 20.6% |
| Yaqui | 0.0 /100 | #292 | Tragic 20.7% |
| Immigrants | Senegal | 0.0 /100 | #293 | Tragic 20.7% |
| Immigrants | Bahamas | 0.0 /100 | #294 | Tragic 20.7% |
| Mexicans | 0.0 /100 | #295 | Tragic 20.7% |
| Indonesians | 0.0 /100 | #296 | Tragic 20.8% |
| Hispanics or Latinos | 0.0 /100 | #297 | Tragic 20.9% |
| Chippewa | 0.0 /100 | #298 | Tragic 21.0% |
| Immigrants | Caribbean | 0.0 /100 | #299 | Tragic 21.0% |