Norwegian vs Immigrants from Belarus Child Poverty Among Boys Under 16
COMPARE
Norwegian
Immigrants from Belarus
Child Poverty Among Boys Under 16
Child Poverty Among Boys Under 16 Comparison
Norwegians
Immigrants from Belarus
13.2%
CHILD POVERTY AMONG BOYS UNDER 16
99.9/ 100
METRIC RATING
17th/ 347
METRIC RANK
15.0%
CHILD POVERTY AMONG BOYS UNDER 16
95.7/ 100
METRIC RATING
101st/ 347
METRIC RANK
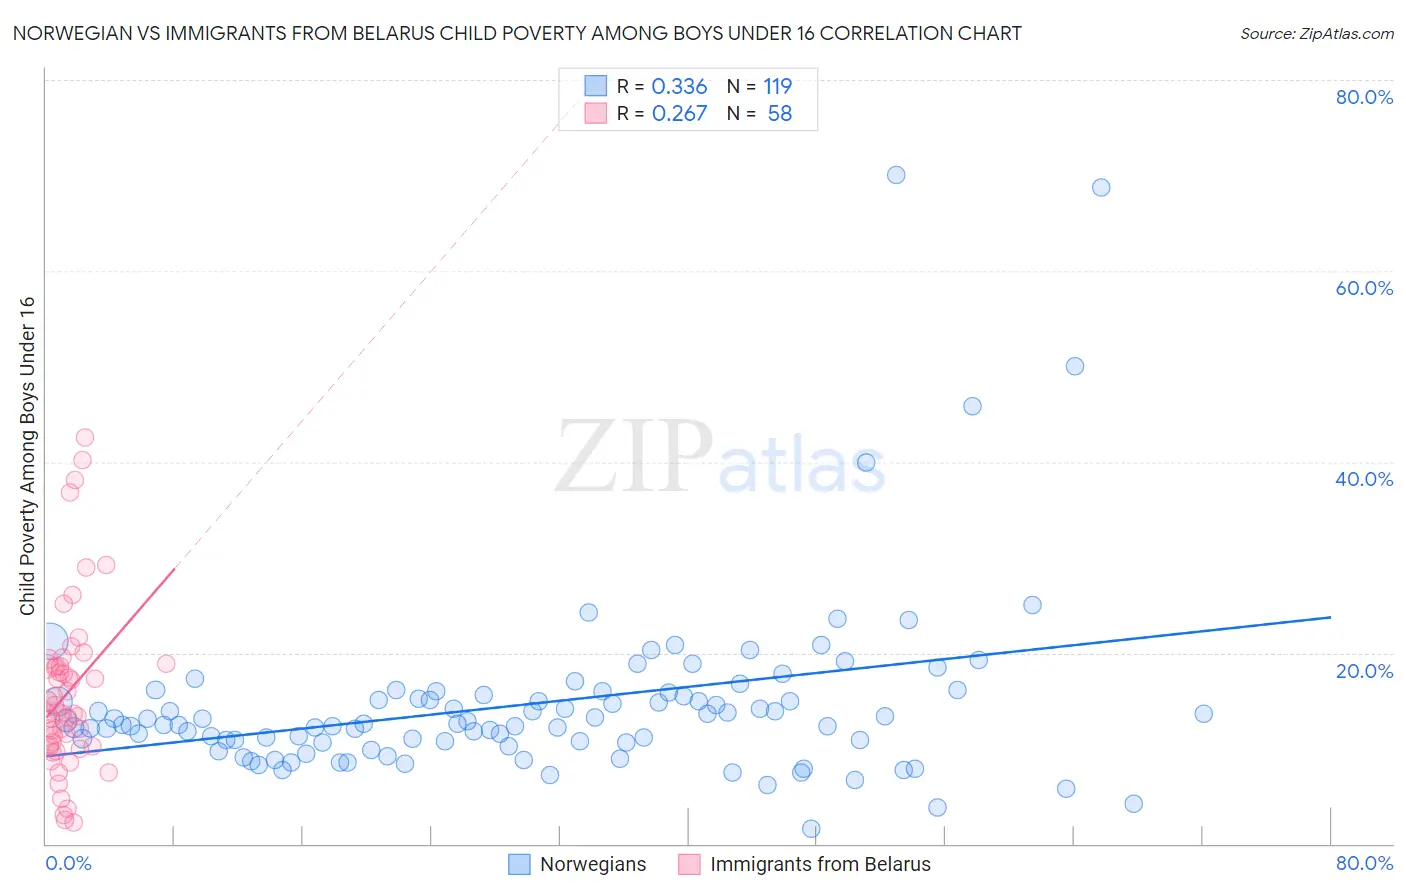
Norwegian vs Immigrants from Belarus Child Poverty Among Boys Under 16 Correlation Chart
The statistical analysis conducted on geographies consisting of 516,210,620 people shows a mild positive correlation between the proportion of Norwegians and poverty level among boys under the age of 16 in the United States with a correlation coefficient (R) of 0.336 and weighted average of 13.2%. Similarly, the statistical analysis conducted on geographies consisting of 148,931,301 people shows a weak positive correlation between the proportion of Immigrants from Belarus and poverty level among boys under the age of 16 in the United States with a correlation coefficient (R) of 0.267 and weighted average of 15.0%, a difference of 13.8%.
Child Poverty Among Boys Under 16 Correlation Summary
| Measurement | Norwegian | Immigrants from Belarus |
| Minimum | 1.6% | 2.2% |
| Maximum | 70.0% | 42.5% |
| Range | 68.4% | 40.4% |
| Mean | 14.7% | 15.8% |
| Median | 12.6% | 13.7% |
| Interquartile 25% (IQ1) | 10.6% | 10.2% |
| Interquartile 75% (IQ3) | 15.6% | 18.6% |
| Interquartile Range (IQR) | 4.9% | 8.4% |
| Standard Deviation (Sample) | 9.8% | 8.8% |
| Standard Deviation (Population) | 9.7% | 8.8% |
Similar Demographics by Child Poverty Among Boys Under 16
Demographics Similar to Norwegians by Child Poverty Among Boys Under 16
In terms of child poverty among boys under 16, the demographic groups most similar to Norwegians are Maltese (13.2%, a difference of 0.090%), Immigrants from Japan (13.1%, a difference of 0.41%), Immigrants from Ireland (13.1%, a difference of 0.51%), Bulgarian (13.3%, a difference of 0.53%), and Bolivian (13.3%, a difference of 0.59%).
| Demographics | Rating | Rank | Child Poverty Among Boys Under 16 |
| Bhutanese | 100.0 /100 | #10 | Exceptional 12.6% |
| Immigrants | South Central Asia | 100.0 /100 | #11 | Exceptional 12.7% |
| Burmese | 99.9 /100 | #12 | Exceptional 13.0% |
| Immigrants | Korea | 99.9 /100 | #13 | Exceptional 13.0% |
| Immigrants | Ireland | 99.9 /100 | #14 | Exceptional 13.1% |
| Immigrants | Japan | 99.9 /100 | #15 | Exceptional 13.1% |
| Maltese | 99.9 /100 | #16 | Exceptional 13.2% |
| Norwegians | 99.9 /100 | #17 | Exceptional 13.2% |
| Bulgarians | 99.9 /100 | #18 | Exceptional 13.3% |
| Bolivians | 99.9 /100 | #19 | Exceptional 13.3% |
| Indians (Asian) | 99.9 /100 | #20 | Exceptional 13.3% |
| Immigrants | Eastern Asia | 99.9 /100 | #21 | Exceptional 13.3% |
| Tongans | 99.9 /100 | #22 | Exceptional 13.4% |
| Latvians | 99.9 /100 | #23 | Exceptional 13.4% |
| Immigrants | Lithuania | 99.8 /100 | #24 | Exceptional 13.5% |
Demographics Similar to Immigrants from Belarus by Child Poverty Among Boys Under 16
In terms of child poverty among boys under 16, the demographic groups most similar to Immigrants from Belarus are Chilean (15.0%, a difference of 0.050%), Romanian (15.0%, a difference of 0.070%), Immigrants from Denmark (15.0%, a difference of 0.11%), Immigrants from Switzerland (15.0%, a difference of 0.21%), and Dutch (15.0%, a difference of 0.22%).
| Demographics | Rating | Rank | Child Poverty Among Boys Under 16 |
| Immigrants | Italy | 96.7 /100 | #94 | Exceptional 14.9% |
| Finns | 96.5 /100 | #95 | Exceptional 14.9% |
| Immigrants | North Macedonia | 96.3 /100 | #96 | Exceptional 14.9% |
| Immigrants | Egypt | 96.2 /100 | #97 | Exceptional 14.9% |
| British | 96.2 /100 | #98 | Exceptional 15.0% |
| Immigrants | France | 96.1 /100 | #99 | Exceptional 15.0% |
| Chileans | 95.8 /100 | #100 | Exceptional 15.0% |
| Immigrants | Belarus | 95.7 /100 | #101 | Exceptional 15.0% |
| Romanians | 95.6 /100 | #102 | Exceptional 15.0% |
| Immigrants | Denmark | 95.6 /100 | #103 | Exceptional 15.0% |
| Immigrants | Switzerland | 95.4 /100 | #104 | Exceptional 15.0% |
| Dutch | 95.4 /100 | #105 | Exceptional 15.0% |
| Serbians | 95.2 /100 | #106 | Exceptional 15.1% |
| Jordanians | 95.1 /100 | #107 | Exceptional 15.1% |
| Immigrants | England | 94.8 /100 | #108 | Exceptional 15.1% |