Egyptian vs Yaqui Child Poverty Among Boys Under 16
COMPARE
Egyptian
Yaqui
Child Poverty Among Boys Under 16
Child Poverty Among Boys Under 16 Comparison
Egyptians
Yaqui
14.7%
CHILD POVERTY AMONG BOYS UNDER 16
97.8/ 100
METRIC RATING
78th/ 347
METRIC RANK
20.7%
CHILD POVERTY AMONG BOYS UNDER 16
0.0/ 100
METRIC RATING
292nd/ 347
METRIC RANK
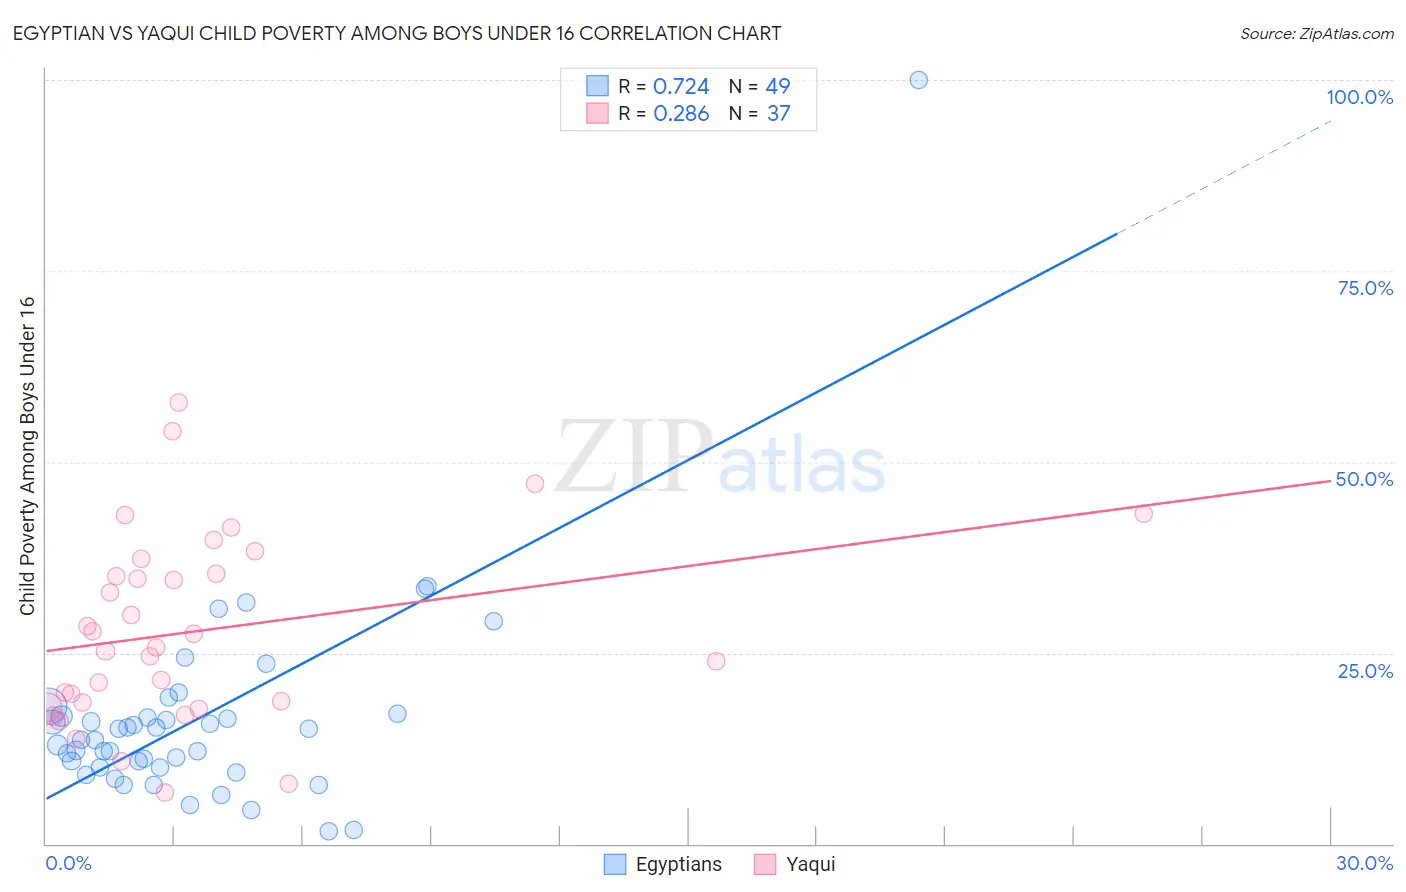
Egyptian vs Yaqui Child Poverty Among Boys Under 16 Correlation Chart
The statistical analysis conducted on geographies consisting of 273,791,496 people shows a strong positive correlation between the proportion of Egyptians and poverty level among boys under the age of 16 in the United States with a correlation coefficient (R) of 0.724 and weighted average of 14.7%. Similarly, the statistical analysis conducted on geographies consisting of 107,428,472 people shows a weak positive correlation between the proportion of Yaqui and poverty level among boys under the age of 16 in the United States with a correlation coefficient (R) of 0.286 and weighted average of 20.7%, a difference of 40.9%.
Child Poverty Among Boys Under 16 Correlation Summary
| Measurement | Egyptian | Yaqui |
| Minimum | 1.6% | 6.7% |
| Maximum | 100.0% | 57.8% |
| Range | 98.4% | 51.1% |
| Mean | 16.4% | 27.9% |
| Median | 13.5% | 25.7% |
| Interquartile 25% (IQ1) | 10.0% | 18.2% |
| Interquartile 75% (IQ3) | 16.9% | 36.3% |
| Interquartile Range (IQR) | 6.9% | 18.1% |
| Standard Deviation (Sample) | 14.3% | 12.4% |
| Standard Deviation (Population) | 14.2% | 12.2% |
Similar Demographics by Child Poverty Among Boys Under 16
Demographics Similar to Egyptians by Child Poverty Among Boys Under 16
In terms of child poverty among boys under 16, the demographic groups most similar to Egyptians are Macedonian (14.7%, a difference of 0.050%), Immigrants from Croatia (14.7%, a difference of 0.11%), Immigrants from Eastern Europe (14.7%, a difference of 0.11%), Immigrants from Poland (14.7%, a difference of 0.16%), and Immigrants from Russia (14.7%, a difference of 0.20%).
| Demographics | Rating | Rank | Child Poverty Among Boys Under 16 |
| Immigrants | Netherlands | 98.1 /100 | #71 | Exceptional 14.6% |
| Immigrants | Latvia | 98.1 /100 | #72 | Exceptional 14.6% |
| Immigrants | Turkey | 98.0 /100 | #73 | Exceptional 14.6% |
| Australians | 98.0 /100 | #74 | Exceptional 14.7% |
| Immigrants | Poland | 97.9 /100 | #75 | Exceptional 14.7% |
| Immigrants | Croatia | 97.9 /100 | #76 | Exceptional 14.7% |
| Macedonians | 97.9 /100 | #77 | Exceptional 14.7% |
| Egyptians | 97.8 /100 | #78 | Exceptional 14.7% |
| Immigrants | Eastern Europe | 97.8 /100 | #79 | Exceptional 14.7% |
| Immigrants | Russia | 97.7 /100 | #80 | Exceptional 14.7% |
| Immigrants | Canada | 97.6 /100 | #81 | Exceptional 14.7% |
| Ukrainians | 97.6 /100 | #82 | Exceptional 14.7% |
| Immigrants | South Africa | 97.4 /100 | #83 | Exceptional 14.8% |
| Swiss | 97.3 /100 | #84 | Exceptional 14.8% |
| Taiwanese | 97.3 /100 | #85 | Exceptional 14.8% |
Demographics Similar to Yaqui by Child Poverty Among Boys Under 16
In terms of child poverty among boys under 16, the demographic groups most similar to Yaqui are Immigrants from Senegal (20.7%, a difference of 0.010%), Immigrants from Bahamas (20.7%, a difference of 0.13%), Mexican (20.7%, a difference of 0.25%), Immigrants from Latin America (20.6%, a difference of 0.26%), and Indonesian (20.8%, a difference of 0.45%).
| Demographics | Rating | Rank | Child Poverty Among Boys Under 16 |
| Arapaho | 0.0 /100 | #285 | Tragic 20.2% |
| West Indians | 0.0 /100 | #286 | Tragic 20.3% |
| Immigrants | Belize | 0.0 /100 | #287 | Tragic 20.3% |
| Immigrants | St. Vincent and the Grenadines | 0.0 /100 | #288 | Tragic 20.3% |
| Blackfeet | 0.0 /100 | #289 | Tragic 20.4% |
| Senegalese | 0.0 /100 | #290 | Tragic 20.6% |
| Immigrants | Latin America | 0.0 /100 | #291 | Tragic 20.6% |
| Yaqui | 0.0 /100 | #292 | Tragic 20.7% |
| Immigrants | Senegal | 0.0 /100 | #293 | Tragic 20.7% |
| Immigrants | Bahamas | 0.0 /100 | #294 | Tragic 20.7% |
| Mexicans | 0.0 /100 | #295 | Tragic 20.7% |
| Indonesians | 0.0 /100 | #296 | Tragic 20.8% |
| Hispanics or Latinos | 0.0 /100 | #297 | Tragic 20.9% |
| Chippewa | 0.0 /100 | #298 | Tragic 21.0% |
| Immigrants | Caribbean | 0.0 /100 | #299 | Tragic 21.0% |