Immigrants from Cameroon vs Yaqui Child Poverty Among Boys Under 16
COMPARE
Immigrants from Cameroon
Yaqui
Child Poverty Among Boys Under 16
Child Poverty Among Boys Under 16 Comparison
Immigrants from Cameroon
Yaqui
17.1%
CHILD POVERTY AMONG BOYS UNDER 16
19.0/ 100
METRIC RATING
198th/ 347
METRIC RANK
20.7%
CHILD POVERTY AMONG BOYS UNDER 16
0.0/ 100
METRIC RATING
292nd/ 347
METRIC RANK
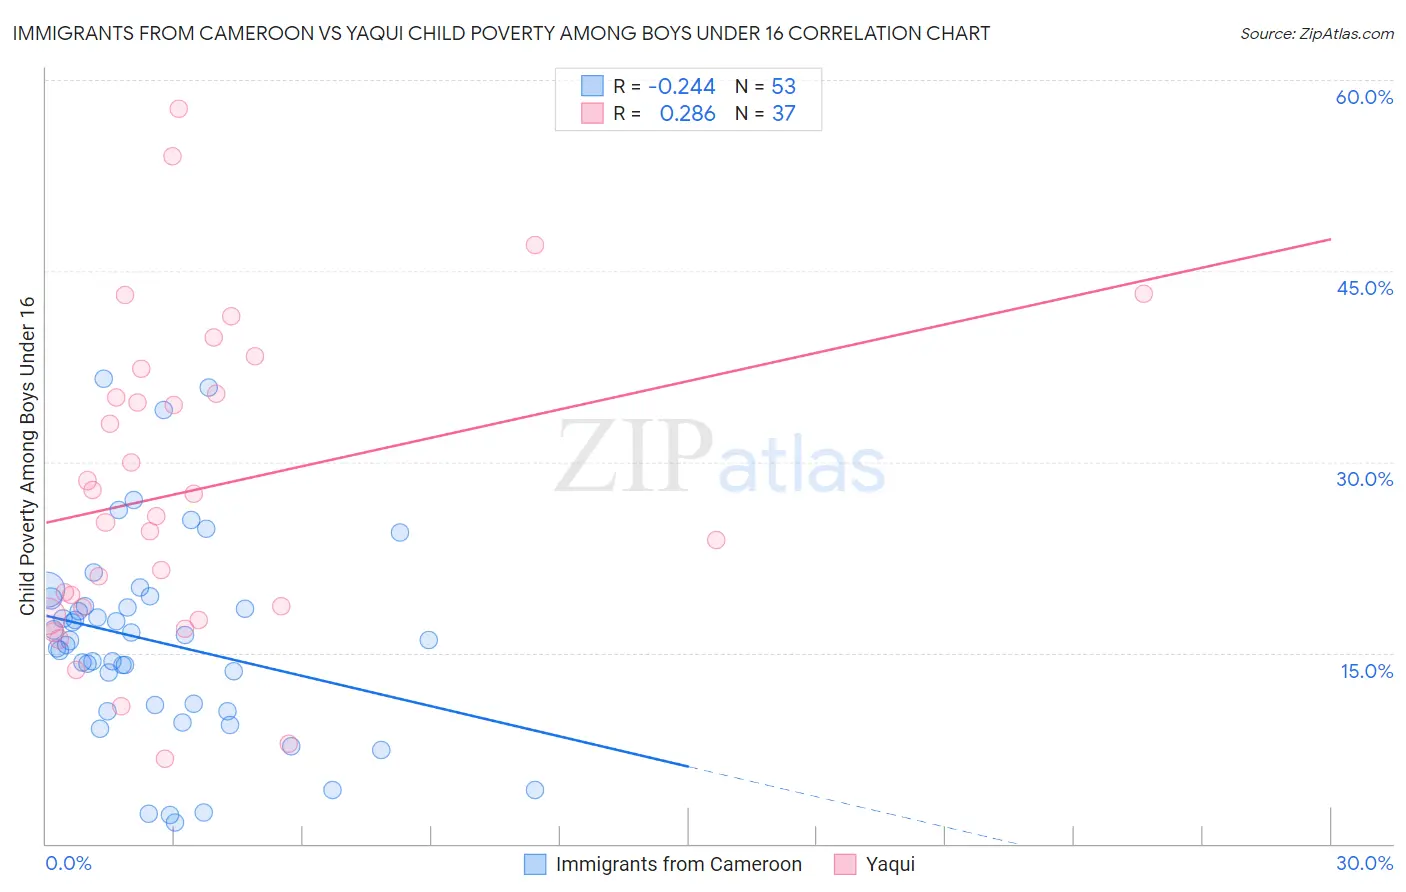
Immigrants from Cameroon vs Yaqui Child Poverty Among Boys Under 16 Correlation Chart
The statistical analysis conducted on geographies consisting of 130,269,448 people shows a weak negative correlation between the proportion of Immigrants from Cameroon and poverty level among boys under the age of 16 in the United States with a correlation coefficient (R) of -0.244 and weighted average of 17.1%. Similarly, the statistical analysis conducted on geographies consisting of 107,428,472 people shows a weak positive correlation between the proportion of Yaqui and poverty level among boys under the age of 16 in the United States with a correlation coefficient (R) of 0.286 and weighted average of 20.7%, a difference of 21.0%.
Child Poverty Among Boys Under 16 Correlation Summary
| Measurement | Immigrants from Cameroon | Yaqui |
| Minimum | 1.7% | 6.7% |
| Maximum | 36.5% | 57.8% |
| Range | 34.8% | 51.1% |
| Mean | 15.8% | 27.9% |
| Median | 16.0% | 25.7% |
| Interquartile 25% (IQ1) | 10.7% | 18.2% |
| Interquartile 75% (IQ3) | 19.0% | 36.3% |
| Interquartile Range (IQR) | 8.3% | 18.1% |
| Standard Deviation (Sample) | 7.8% | 12.4% |
| Standard Deviation (Population) | 7.8% | 12.2% |
Similar Demographics by Child Poverty Among Boys Under 16
Demographics Similar to Immigrants from Cameroon by Child Poverty Among Boys Under 16
In terms of child poverty among boys under 16, the demographic groups most similar to Immigrants from Cameroon are Delaware (17.1%, a difference of 0.040%), Immigrants from Kenya (17.1%, a difference of 0.19%), Spaniard (17.1%, a difference of 0.25%), Spanish (17.0%, a difference of 0.30%), and Immigrants from Lebanon (17.0%, a difference of 0.37%).
| Demographics | Rating | Rank | Child Poverty Among Boys Under 16 |
| Alaska Natives | 29.8 /100 | #191 | Fair 16.8% |
| Immigrants | Uganda | 21.6 /100 | #192 | Fair 17.0% |
| Immigrants | Iraq | 21.6 /100 | #193 | Fair 17.0% |
| Immigrants | Lebanon | 21.2 /100 | #194 | Fair 17.0% |
| Spanish | 20.8 /100 | #195 | Fair 17.0% |
| Spaniards | 20.5 /100 | #196 | Fair 17.1% |
| Immigrants | Kenya | 20.1 /100 | #197 | Fair 17.1% |
| Immigrants | Cameroon | 19.0 /100 | #198 | Poor 17.1% |
| Delaware | 18.8 /100 | #199 | Poor 17.1% |
| Immigrants | Uruguay | 16.9 /100 | #200 | Poor 17.2% |
| Immigrants | Afghanistan | 13.7 /100 | #201 | Poor 17.3% |
| Immigrants | Sierra Leone | 13.4 /100 | #202 | Poor 17.3% |
| Immigrants | Uzbekistan | 13.3 /100 | #203 | Poor 17.3% |
| Ugandans | 12.5 /100 | #204 | Poor 17.3% |
| Immigrants | Portugal | 11.2 /100 | #205 | Poor 17.4% |
Demographics Similar to Yaqui by Child Poverty Among Boys Under 16
In terms of child poverty among boys under 16, the demographic groups most similar to Yaqui are Immigrants from Senegal (20.7%, a difference of 0.010%), Immigrants from Bahamas (20.7%, a difference of 0.13%), Mexican (20.7%, a difference of 0.25%), Immigrants from Latin America (20.6%, a difference of 0.26%), and Indonesian (20.8%, a difference of 0.45%).
| Demographics | Rating | Rank | Child Poverty Among Boys Under 16 |
| Arapaho | 0.0 /100 | #285 | Tragic 20.2% |
| West Indians | 0.0 /100 | #286 | Tragic 20.3% |
| Immigrants | Belize | 0.0 /100 | #287 | Tragic 20.3% |
| Immigrants | St. Vincent and the Grenadines | 0.0 /100 | #288 | Tragic 20.3% |
| Blackfeet | 0.0 /100 | #289 | Tragic 20.4% |
| Senegalese | 0.0 /100 | #290 | Tragic 20.6% |
| Immigrants | Latin America | 0.0 /100 | #291 | Tragic 20.6% |
| Yaqui | 0.0 /100 | #292 | Tragic 20.7% |
| Immigrants | Senegal | 0.0 /100 | #293 | Tragic 20.7% |
| Immigrants | Bahamas | 0.0 /100 | #294 | Tragic 20.7% |
| Mexicans | 0.0 /100 | #295 | Tragic 20.7% |
| Indonesians | 0.0 /100 | #296 | Tragic 20.8% |
| Hispanics or Latinos | 0.0 /100 | #297 | Tragic 20.9% |
| Chippewa | 0.0 /100 | #298 | Tragic 21.0% |
| Immigrants | Caribbean | 0.0 /100 | #299 | Tragic 21.0% |