Norwegian vs Polish Receiving Food Stamps
COMPARE
Norwegian
Polish
Receiving Food Stamps
Receiving Food Stamps Comparison
Norwegians
Poles
9.0%
RECEIVING FOOD STAMPS
99.9/ 100
METRIC RATING
15th/ 347
METRIC RANK
10.0%
RECEIVING FOOD STAMPS
98.6/ 100
METRIC RATING
80th/ 347
METRIC RANK
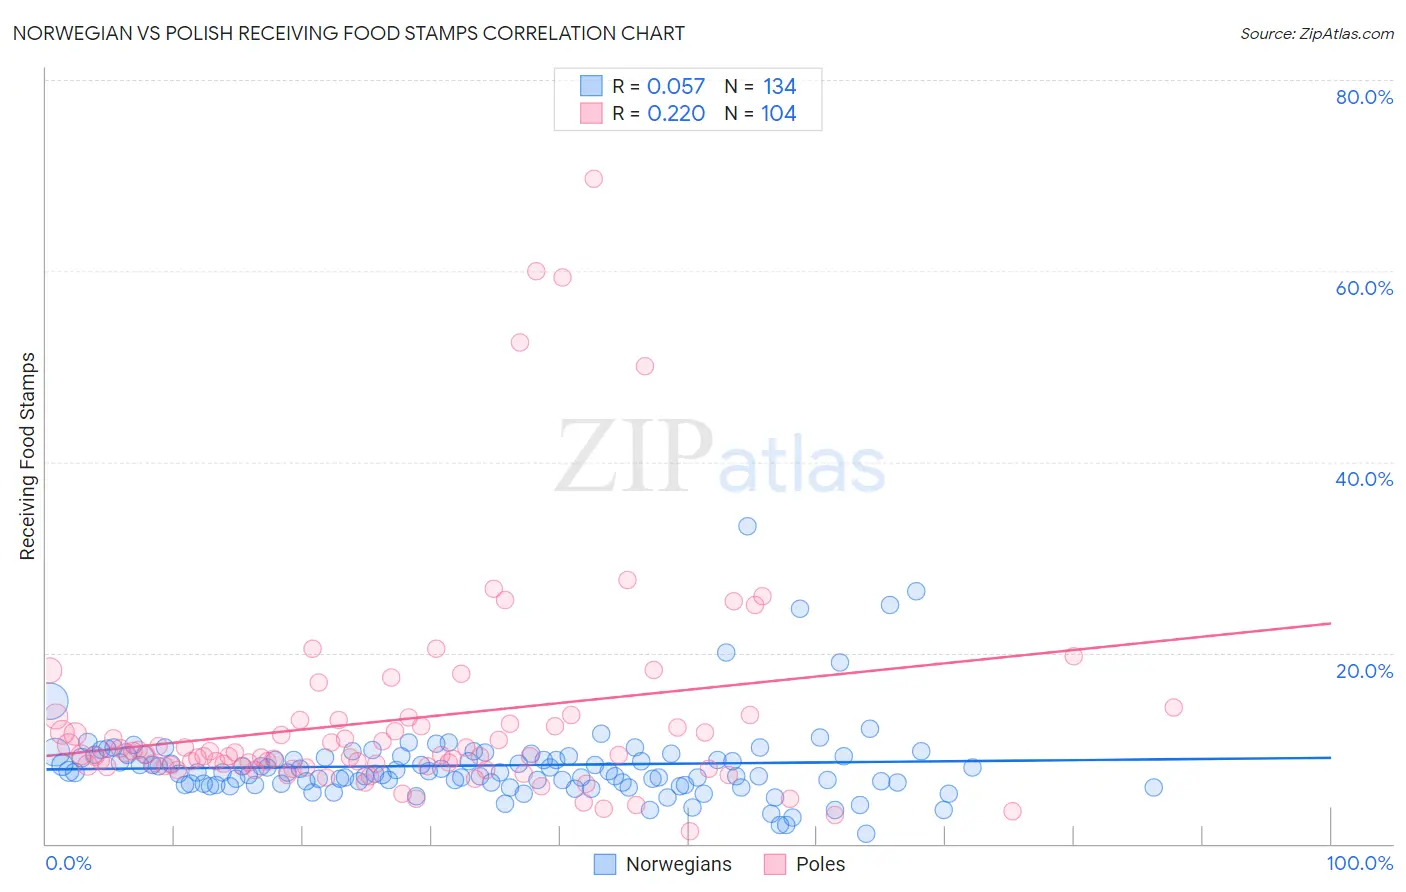
Norwegian vs Polish Receiving Food Stamps Correlation Chart
The statistical analysis conducted on geographies consisting of 530,518,584 people shows a slight positive correlation between the proportion of Norwegians and percentage of population receiving government assistance and/or food stamps in the United States with a correlation coefficient (R) of 0.057 and weighted average of 9.0%. Similarly, the statistical analysis conducted on geographies consisting of 556,985,146 people shows a weak positive correlation between the proportion of Poles and percentage of population receiving government assistance and/or food stamps in the United States with a correlation coefficient (R) of 0.220 and weighted average of 10.0%, a difference of 11.3%.
Receiving Food Stamps Correlation Summary
| Measurement | Norwegian | Polish |
| Minimum | 1.1% | 1.3% |
| Maximum | 33.3% | 69.7% |
| Range | 32.2% | 68.4% |
| Mean | 8.2% | 13.0% |
| Median | 7.5% | 9.3% |
| Interquartile 25% (IQ1) | 6.3% | 8.1% |
| Interquartile 75% (IQ3) | 9.1% | 12.7% |
| Interquartile Range (IQR) | 2.8% | 4.6% |
| Standard Deviation (Sample) | 4.3% | 11.6% |
| Standard Deviation (Population) | 4.3% | 11.5% |
Similar Demographics by Receiving Food Stamps
Demographics Similar to Norwegians by Receiving Food Stamps
In terms of receiving food stamps, the demographic groups most similar to Norwegians are Immigrants from Japan (9.0%, a difference of 0.27%), Immigrants from Scotland (9.0%, a difference of 0.43%), Maltese (8.9%, a difference of 0.66%), Bulgarian (8.9%, a difference of 0.79%), and Danish (9.0%, a difference of 0.88%).
| Demographics | Rating | Rank | Receiving Food Stamps |
| Burmese | 99.9 /100 | #8 | Exceptional 8.6% |
| Immigrants | Korea | 99.9 /100 | #9 | Exceptional 8.7% |
| Immigrants | South Central Asia | 99.9 /100 | #10 | Exceptional 8.8% |
| Okinawans | 99.9 /100 | #11 | Exceptional 8.9% |
| Cypriots | 99.9 /100 | #12 | Exceptional 8.9% |
| Bulgarians | 99.9 /100 | #13 | Exceptional 8.9% |
| Maltese | 99.9 /100 | #14 | Exceptional 8.9% |
| Norwegians | 99.9 /100 | #15 | Exceptional 9.0% |
| Immigrants | Japan | 99.9 /100 | #16 | Exceptional 9.0% |
| Immigrants | Scotland | 99.9 /100 | #17 | Exceptional 9.0% |
| Danes | 99.9 /100 | #18 | Exceptional 9.0% |
| Immigrants | Hong Kong | 99.8 /100 | #19 | Exceptional 9.1% |
| Latvians | 99.8 /100 | #20 | Exceptional 9.1% |
| Luxembourgers | 99.8 /100 | #21 | Exceptional 9.1% |
| Immigrants | Australia | 99.8 /100 | #22 | Exceptional 9.2% |
Demographics Similar to Poles by Receiving Food Stamps
In terms of receiving food stamps, the demographic groups most similar to Poles are Laotian (10.0%, a difference of 0.080%), South African (10.0%, a difference of 0.12%), Immigrants from England (10.0%, a difference of 0.14%), Immigrants from North Macedonia (10.0%, a difference of 0.16%), and Immigrants from Croatia (10.0%, a difference of 0.25%).
| Demographics | Rating | Rank | Receiving Food Stamps |
| Macedonians | 98.9 /100 | #73 | Exceptional 9.9% |
| New Zealanders | 98.8 /100 | #74 | Exceptional 9.9% |
| Immigrants | Zimbabwe | 98.7 /100 | #75 | Exceptional 9.9% |
| Immigrants | Croatia | 98.7 /100 | #76 | Exceptional 10.0% |
| Immigrants | North Macedonia | 98.7 /100 | #77 | Exceptional 10.0% |
| South Africans | 98.7 /100 | #78 | Exceptional 10.0% |
| Laotians | 98.7 /100 | #79 | Exceptional 10.0% |
| Poles | 98.6 /100 | #80 | Exceptional 10.0% |
| Immigrants | England | 98.6 /100 | #81 | Exceptional 10.0% |
| Austrians | 98.6 /100 | #82 | Exceptional 10.0% |
| Dutch | 98.6 /100 | #83 | Exceptional 10.0% |
| Immigrants | Israel | 98.5 /100 | #84 | Exceptional 10.0% |
| Immigrants | Romania | 98.5 /100 | #85 | Exceptional 10.0% |
| Immigrants | Norway | 98.4 /100 | #86 | Exceptional 10.0% |
| Egyptians | 98.4 /100 | #87 | Exceptional 10.0% |