Norwegian vs Czechoslovakian Unemployment Among Seniors over 75 years
COMPARE
Norwegian
Czechoslovakian
Unemployment Among Seniors over 75 years
Unemployment Among Seniors over 75 years Comparison
Norwegians
Czechoslovakians
9.8%
UNEMPLOYMENT AMONG SENIORS OVER 75 YEARS
0.0/ 100
METRIC RATING
293rd/ 347
METRIC RANK
9.4%
UNEMPLOYMENT AMONG SENIORS OVER 75 YEARS
0.3/ 100
METRIC RATING
273rd/ 347
METRIC RANK
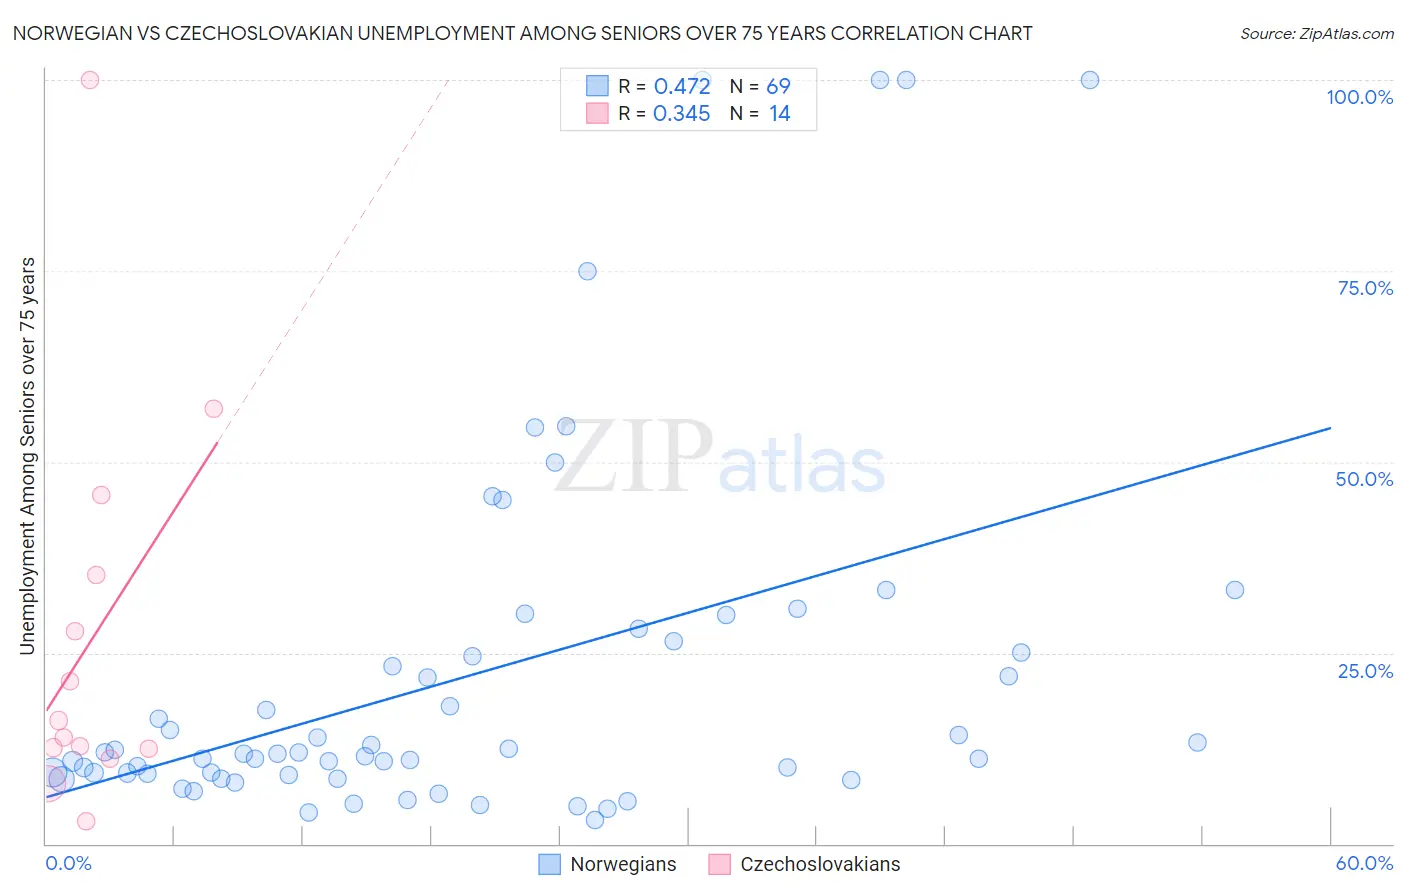
Norwegian vs Czechoslovakian Unemployment Among Seniors over 75 years Correlation Chart
The statistical analysis conducted on geographies consisting of 229,000,677 people shows a moderate positive correlation between the proportion of Norwegians and unemployment rate among seniors over the age of 75 in the United States with a correlation coefficient (R) of 0.472 and weighted average of 9.8%. Similarly, the statistical analysis conducted on geographies consisting of 187,754,654 people shows a mild positive correlation between the proportion of Czechoslovakians and unemployment rate among seniors over the age of 75 in the United States with a correlation coefficient (R) of 0.345 and weighted average of 9.4%, a difference of 3.7%.
Unemployment Among Seniors over 75 years Correlation Summary
| Measurement | Norwegian | Czechoslovakian |
| Minimum | 3.1% | 2.9% |
| Maximum | 100.0% | 100.0% |
| Range | 96.9% | 97.1% |
| Mean | 22.1% | 26.9% |
| Median | 11.7% | 15.0% |
| Interquartile 25% (IQ1) | 9.1% | 12.5% |
| Interquartile 75% (IQ3) | 25.8% | 35.2% |
| Interquartile Range (IQR) | 16.7% | 22.7% |
| Standard Deviation (Sample) | 24.0% | 26.0% |
| Standard Deviation (Population) | 23.8% | 25.0% |
Demographics Similar to Norwegians and Czechoslovakians by Unemployment Among Seniors over 75 years
In terms of unemployment among seniors over 75 years, the demographic groups most similar to Norwegians are Immigrants from Western Africa (9.8%, a difference of 0.17%), Scandinavian (9.7%, a difference of 0.46%), Sioux (9.7%, a difference of 0.84%), Czech (9.7%, a difference of 0.91%), and Canadian (9.7%, a difference of 0.99%). Similarly, the demographic groups most similar to Czechoslovakians are Jamaican (9.5%, a difference of 0.12%), Senegalese (9.5%, a difference of 0.32%), Arab (9.5%, a difference of 0.41%), Swiss (9.5%, a difference of 0.91%), and Immigrants from Senegal (9.6%, a difference of 1.2%).
| Demographics | Rating | Rank | Unemployment Among Seniors over 75 years |
| Czechoslovakians | 0.3 /100 | #273 | Tragic 9.4% |
| Jamaicans | 0.2 /100 | #274 | Tragic 9.5% |
| Senegalese | 0.2 /100 | #275 | Tragic 9.5% |
| Arabs | 0.2 /100 | #276 | Tragic 9.5% |
| Swiss | 0.1 /100 | #277 | Tragic 9.5% |
| Immigrants | Senegal | 0.1 /100 | #278 | Tragic 9.6% |
| British | 0.1 /100 | #279 | Tragic 9.6% |
| Croatians | 0.1 /100 | #280 | Tragic 9.6% |
| Bangladeshis | 0.1 /100 | #281 | Tragic 9.6% |
| Macedonians | 0.0 /100 | #282 | Tragic 9.6% |
| Immigrants | Nigeria | 0.0 /100 | #283 | Tragic 9.6% |
| Europeans | 0.0 /100 | #284 | Tragic 9.7% |
| Carpatho Rusyns | 0.0 /100 | #285 | Tragic 9.7% |
| Nigerians | 0.0 /100 | #286 | Tragic 9.7% |
| Danes | 0.0 /100 | #287 | Tragic 9.7% |
| Canadians | 0.0 /100 | #288 | Tragic 9.7% |
| Czechs | 0.0 /100 | #289 | Tragic 9.7% |
| Sioux | 0.0 /100 | #290 | Tragic 9.7% |
| Scandinavians | 0.0 /100 | #291 | Tragic 9.7% |
| Immigrants | Western Africa | 0.0 /100 | #292 | Tragic 9.8% |
| Norwegians | 0.0 /100 | #293 | Tragic 9.8% |