Northern European vs Immigrants from Sri Lanka Seniors Poverty Over the Age of 65
COMPARE
Northern European
Immigrants from Sri Lanka
Seniors Poverty Over the Age of 65
Seniors Poverty Over the Age of 65 Comparison
Northern Europeans
Immigrants from Sri Lanka
9.4%
SENIORS POVERTY OVER THE AGE OF 65
99.8/ 100
METRIC RATING
32nd/ 347
METRIC RANK
10.1%
SENIORS POVERTY OVER THE AGE OF 65
97.3/ 100
METRIC RATING
81st/ 347
METRIC RANK
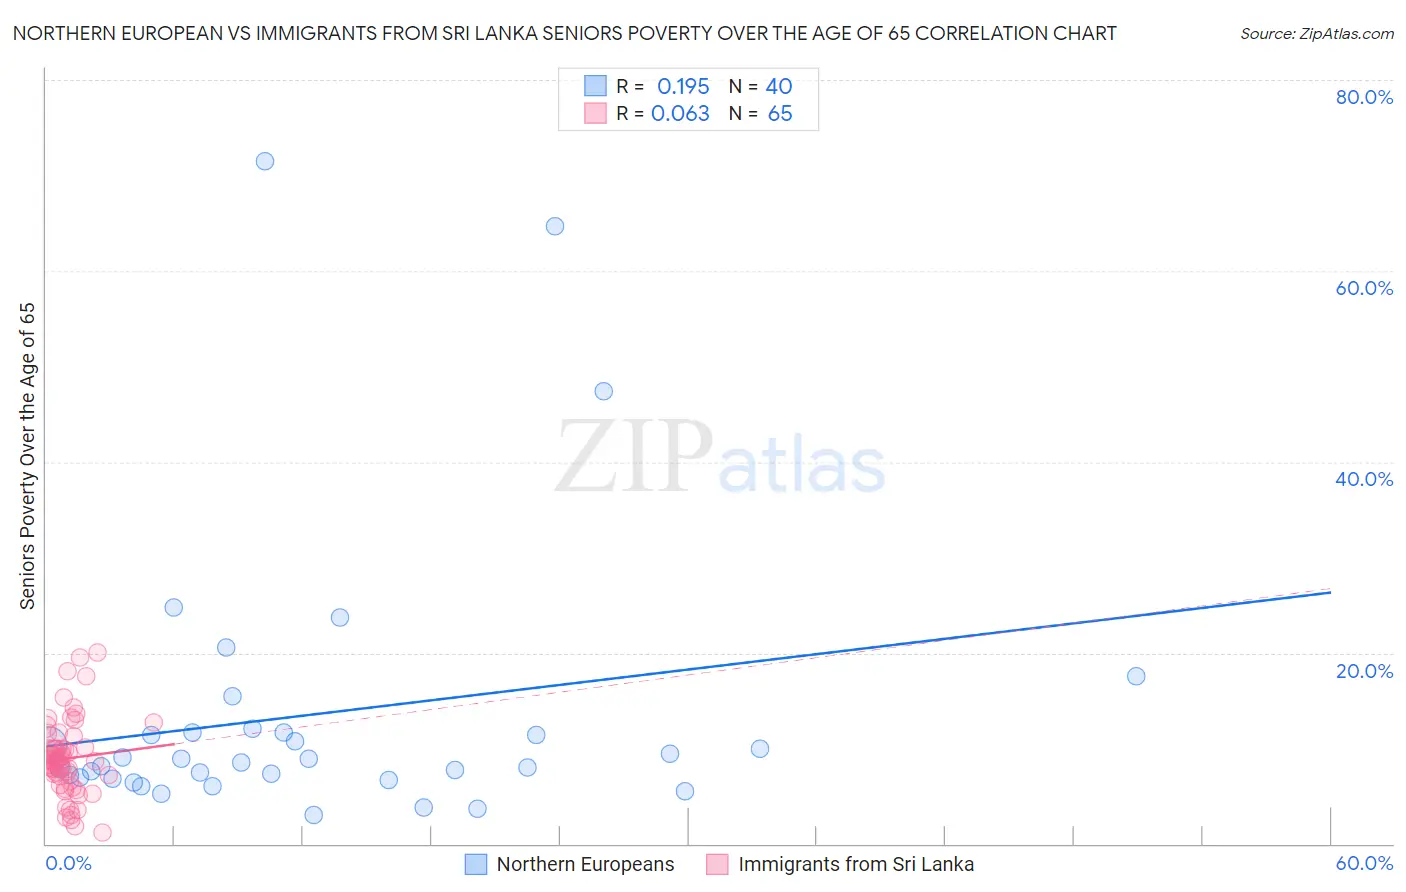
Northern European vs Immigrants from Sri Lanka Seniors Poverty Over the Age of 65 Correlation Chart
The statistical analysis conducted on geographies consisting of 404,631,696 people shows a poor positive correlation between the proportion of Northern Europeans and poverty level among seniors over the age of 65 in the United States with a correlation coefficient (R) of 0.195 and weighted average of 9.4%. Similarly, the statistical analysis conducted on geographies consisting of 149,599,044 people shows a slight positive correlation between the proportion of Immigrants from Sri Lanka and poverty level among seniors over the age of 65 in the United States with a correlation coefficient (R) of 0.063 and weighted average of 10.1%, a difference of 7.0%.
Seniors Poverty Over the Age of 65 Correlation Summary
| Measurement | Northern European | Immigrants from Sri Lanka |
| Minimum | 3.0% | 1.1% |
| Maximum | 71.5% | 20.0% |
| Range | 68.5% | 18.9% |
| Mean | 13.5% | 8.9% |
| Median | 8.7% | 8.7% |
| Interquartile 25% (IQ1) | 6.9% | 6.9% |
| Interquartile 75% (IQ3) | 11.6% | 10.0% |
| Interquartile Range (IQR) | 4.7% | 3.1% |
| Standard Deviation (Sample) | 14.8% | 4.0% |
| Standard Deviation (Population) | 14.6% | 3.9% |
Similar Demographics by Seniors Poverty Over the Age of 65
Demographics Similar to Northern Europeans by Seniors Poverty Over the Age of 65
In terms of seniors poverty over the age of 65, the demographic groups most similar to Northern Europeans are Native Hawaiian (9.4%, a difference of 0.020%), British (9.4%, a difference of 0.12%), Finnish (9.4%, a difference of 0.28%), Menominee (9.4%, a difference of 0.50%), and Latvian (9.5%, a difference of 0.50%).
| Demographics | Rating | Rank | Seniors Poverty Over the Age of 65 |
| Irish | 99.9 /100 | #25 | Exceptional 9.3% |
| Immigrants | Scotland | 99.9 /100 | #26 | Exceptional 9.3% |
| Italians | 99.9 /100 | #27 | Exceptional 9.3% |
| Tongans | 99.9 /100 | #28 | Exceptional 9.3% |
| Bhutanese | 99.9 /100 | #29 | Exceptional 9.3% |
| Menominee | 99.8 /100 | #30 | Exceptional 9.4% |
| Finns | 99.8 /100 | #31 | Exceptional 9.4% |
| Northern Europeans | 99.8 /100 | #32 | Exceptional 9.4% |
| Native Hawaiians | 99.8 /100 | #33 | Exceptional 9.4% |
| British | 99.8 /100 | #34 | Exceptional 9.4% |
| Latvians | 99.8 /100 | #35 | Exceptional 9.5% |
| Czechoslovakians | 99.8 /100 | #36 | Exceptional 9.5% |
| Scotch-Irish | 99.7 /100 | #37 | Exceptional 9.5% |
| Belgians | 99.7 /100 | #38 | Exceptional 9.5% |
| Greeks | 99.6 /100 | #39 | Exceptional 9.6% |
Demographics Similar to Immigrants from Sri Lanka by Seniors Poverty Over the Age of 65
In terms of seniors poverty over the age of 65, the demographic groups most similar to Immigrants from Sri Lanka are Korean (10.1%, a difference of 0.030%), Immigrants from Bolivia (10.1%, a difference of 0.070%), Immigrants from Poland (10.1%, a difference of 0.10%), Immigrants from Afghanistan (10.1%, a difference of 0.12%), and Immigrants from Nepal (10.1%, a difference of 0.12%).
| Demographics | Rating | Rank | Seniors Poverty Over the Age of 65 |
| Turks | 97.9 /100 | #74 | Exceptional 10.0% |
| Immigrants | Czechoslovakia | 97.8 /100 | #75 | Exceptional 10.0% |
| New Zealanders | 97.7 /100 | #76 | Exceptional 10.0% |
| Immigrants | South Africa | 97.7 /100 | #77 | Exceptional 10.0% |
| Whites/Caucasians | 97.5 /100 | #78 | Exceptional 10.0% |
| Immigrants | Ireland | 97.5 /100 | #79 | Exceptional 10.0% |
| Koreans | 97.4 /100 | #80 | Exceptional 10.1% |
| Immigrants | Sri Lanka | 97.3 /100 | #81 | Exceptional 10.1% |
| Immigrants | Bolivia | 97.3 /100 | #82 | Exceptional 10.1% |
| Immigrants | Poland | 97.2 /100 | #83 | Exceptional 10.1% |
| Immigrants | Afghanistan | 97.2 /100 | #84 | Exceptional 10.1% |
| Immigrants | Nepal | 97.2 /100 | #85 | Exceptional 10.1% |
| Romanians | 97.2 /100 | #86 | Exceptional 10.1% |
| Burmese | 97.2 /100 | #87 | Exceptional 10.1% |
| Jordanians | 97.1 /100 | #88 | Exceptional 10.1% |