French American Indian vs Senegalese Seniors Poverty Over the Age of 65
COMPARE
French American Indian
Senegalese
Seniors Poverty Over the Age of 65
Seniors Poverty Over the Age of 65 Comparison
French American Indians
Senegalese
11.5%
SENIORS POVERTY OVER THE AGE OF 65
8.7/ 100
METRIC RATING
215th/ 347
METRIC RANK
13.3%
SENIORS POVERTY OVER THE AGE OF 65
0.0/ 100
METRIC RATING
282nd/ 347
METRIC RANK
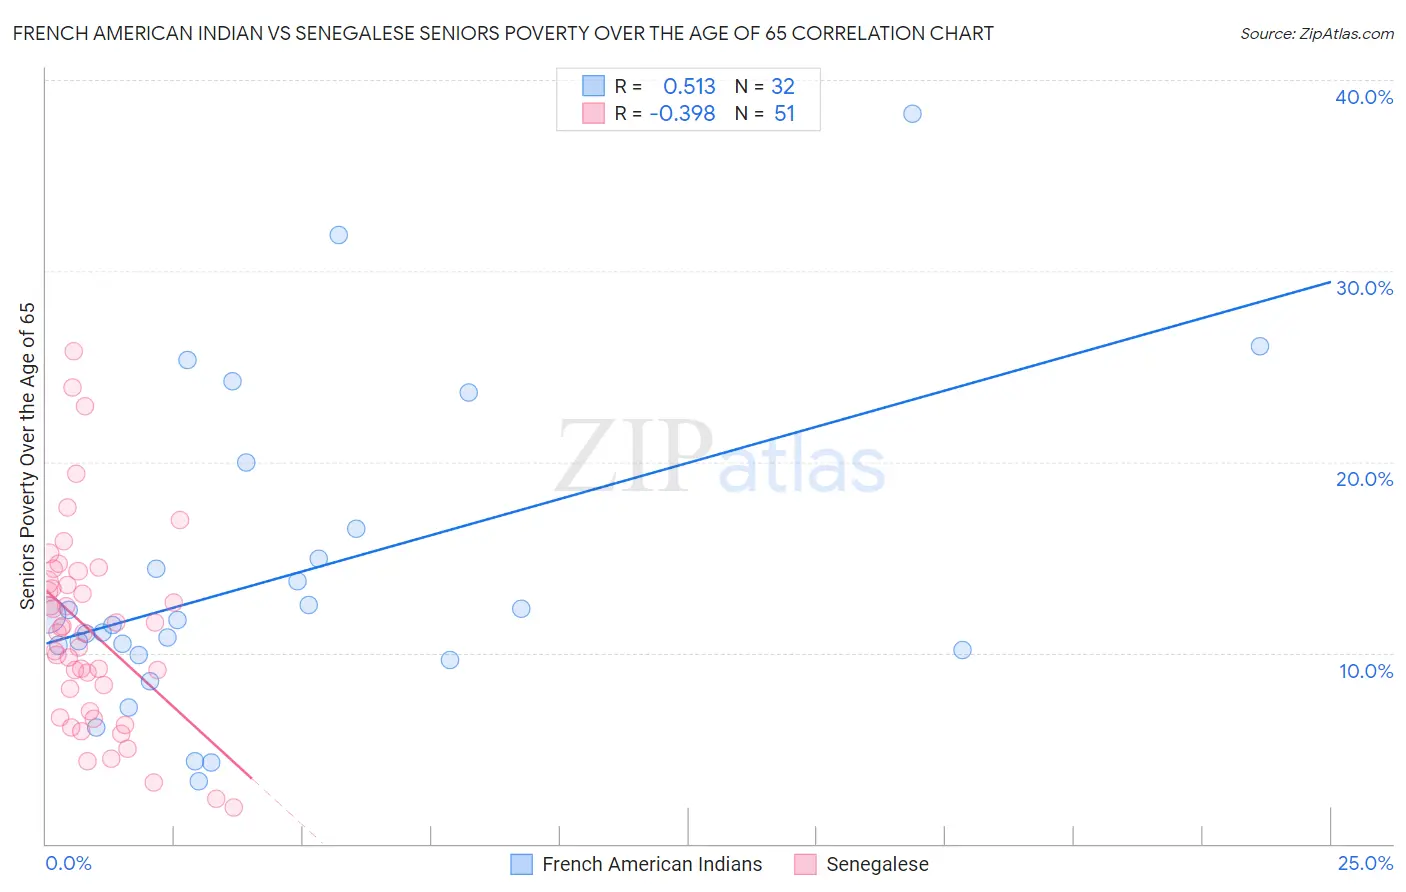
French American Indian vs Senegalese Seniors Poverty Over the Age of 65 Correlation Chart
The statistical analysis conducted on geographies consisting of 131,882,711 people shows a substantial positive correlation between the proportion of French American Indians and poverty level among seniors over the age of 65 in the United States with a correlation coefficient (R) of 0.513 and weighted average of 11.5%. Similarly, the statistical analysis conducted on geographies consisting of 77,978,779 people shows a mild negative correlation between the proportion of Senegalese and poverty level among seniors over the age of 65 in the United States with a correlation coefficient (R) of -0.398 and weighted average of 13.3%, a difference of 15.3%.
Seniors Poverty Over the Age of 65 Correlation Summary
| Measurement | French American Indian | Senegalese |
| Minimum | 3.3% | 1.9% |
| Maximum | 38.2% | 25.8% |
| Range | 35.0% | 23.9% |
| Mean | 14.0% | 11.1% |
| Median | 11.6% | 11.1% |
| Interquartile 25% (IQ1) | 10.0% | 7.0% |
| Interquartile 75% (IQ3) | 15.7% | 13.7% |
| Interquartile Range (IQR) | 5.7% | 6.7% |
| Standard Deviation (Sample) | 8.0% | 5.2% |
| Standard Deviation (Population) | 7.9% | 5.1% |
Similar Demographics by Seniors Poverty Over the Age of 65
Demographics Similar to French American Indians by Seniors Poverty Over the Age of 65
In terms of seniors poverty over the age of 65, the demographic groups most similar to French American Indians are Immigrants from Russia (11.5%, a difference of 0.040%), Nepalese (11.5%, a difference of 0.060%), Immigrants from China (11.5%, a difference of 0.22%), Indonesian (11.5%, a difference of 0.42%), and Immigrants from Morocco (11.6%, a difference of 0.55%).
| Demographics | Rating | Rank | Seniors Poverty Over the Age of 65 |
| South American Indians | 11.7 /100 | #208 | Poor 11.4% |
| Paraguayans | 11.3 /100 | #209 | Poor 11.4% |
| Ugandans | 11.2 /100 | #210 | Poor 11.4% |
| Indonesians | 10.4 /100 | #211 | Poor 11.5% |
| Immigrants | China | 9.5 /100 | #212 | Tragic 11.5% |
| Nepalese | 8.9 /100 | #213 | Tragic 11.5% |
| Immigrants | Russia | 8.8 /100 | #214 | Tragic 11.5% |
| French American Indians | 8.7 /100 | #215 | Tragic 11.5% |
| Immigrants | Morocco | 6.8 /100 | #216 | Tragic 11.6% |
| Immigrants | Africa | 6.4 /100 | #217 | Tragic 11.6% |
| Immigrants | Ukraine | 5.7 /100 | #218 | Tragic 11.6% |
| Arapaho | 5.2 /100 | #219 | Tragic 11.6% |
| Peruvians | 4.2 /100 | #220 | Tragic 11.7% |
| Argentineans | 4.1 /100 | #221 | Tragic 11.7% |
| Immigrants | Chile | 3.9 /100 | #222 | Tragic 11.7% |
Demographics Similar to Senegalese by Seniors Poverty Over the Age of 65
In terms of seniors poverty over the age of 65, the demographic groups most similar to Senegalese are Central American (13.4%, a difference of 0.82%), Immigrants from El Salvador (13.1%, a difference of 1.1%), Yuman (13.1%, a difference of 1.5%), Mexican (13.1%, a difference of 1.6%), and Immigrants from Bahamas (13.0%, a difference of 1.7%).
| Demographics | Rating | Rank | Seniors Poverty Over the Age of 65 |
| Immigrants | Colombia | 0.0 /100 | #275 | Tragic 12.9% |
| Immigrants | Azores | 0.0 /100 | #276 | Tragic 12.9% |
| Paiute | 0.0 /100 | #277 | Tragic 12.9% |
| Immigrants | Bahamas | 0.0 /100 | #278 | Tragic 13.0% |
| Mexicans | 0.0 /100 | #279 | Tragic 13.1% |
| Yuman | 0.0 /100 | #280 | Tragic 13.1% |
| Immigrants | El Salvador | 0.0 /100 | #281 | Tragic 13.1% |
| Senegalese | 0.0 /100 | #282 | Tragic 13.3% |
| Central Americans | 0.0 /100 | #283 | Tragic 13.4% |
| Colville | 0.0 /100 | #284 | Tragic 13.5% |
| Guatemalans | 0.0 /100 | #285 | Tragic 13.5% |
| Immigrants | Senegal | 0.0 /100 | #286 | Tragic 13.6% |
| Immigrants | Mexico | 0.0 /100 | #287 | Tragic 13.6% |
| Belizeans | 0.0 /100 | #288 | Tragic 13.6% |
| Jamaicans | 0.0 /100 | #289 | Tragic 13.6% |