Liberian vs Armenian Family Poverty

COMPARE

Liberian
Race
Ancestry
AfghanAfricanAlaska NativeAlaskan AthabascanAlbanianAleutAlsatianAmericanApacheArabArapahoArgentineanAssyrian/Chaldean/SyriacAustralianAustrianBahamianBangladeshiBarbadianBasqueBelgianBelizeanBermudanBhutaneseBlackfeetBolivianBrazilianBritishBritish West IndianBulgarianBurmeseCajunCambodianCanadianCape VerdeanCarpatho RusynCelticCentral AmericanCentral American IndianCherokeeCheyenneChickasawChileanChineseChippewaChoctawColombianColvilleComancheCosta RicanCreeCreekCroatianCrowCubanCypriotCzechCzechoslovakianDanishDelawareDominicanDutchDutch West IndianEastern EuropeanEcuadorianEgyptianEnglishEstonianEthiopianEuropeanFijianFilipinoFinnishFrenchFrench American IndianFrench CanadianGermanGerman RussianGhanaianGreekGuamanian/ChamorroGuatemalanGuyaneseHaitianHmongHonduranHopiHoumaHungarianIcelanderIndian (Asian)IndonesianInupiatIranianIraqiIrishIroquoisIsraeliItalianJamaicanJapaneseJordanianKenyanKiowaKoreanLaotianLatvianLebaneseLiberianLithuanianLumbeeLuxembourgerMacedonianMalaysianMalteseMarshalleseMenomineeMexicanMexican American IndianMongolianMoroccanNative HawaiianNavajoNepaleseNew ZealanderNicaraguanNigerianNorthern EuropeanNorwegianOkinawanOsageOttawaPaiutePakistaniPalestinianPanamanianParaguayanPennsylvania GermanPeruvianPimaPolishPortuguesePotawatomiPuebloPuerto RicanPuget Sound SalishRomanianRussianSalvadoranSamoanScandinavianScotch-IrishScottishSeminoleSenegaleseSerbianShoshoneSierra LeoneanSiouxSlavicSlovakSloveneSomaliSouth AfricanSouth AmericanSouth American IndianSoviet UnionSpaniardSpanishSpanish AmericanSpanish American IndianSri LankanSubsaharan AfricanSudaneseSwedishSwissSyrianTaiwaneseThaiTlingit-HaidaTohono O'OdhamTonganTrinidadian and TobagonianTsimshianTurkishU.S. Virgin IslanderUgandanUkrainianUruguayanUteVenezuelanVietnameseWelshWest IndianYakamaYaquiYugoslavianYumanYup'ikZimbabwean
Immigration
NonimmigrantsImmigrantsAfghanistanAfricaAlbaniaArgentinaArmeniaAsiaAustraliaAustriaBahamasBangladeshBarbadosBelarusBelgiumBelizeBoliviaBosnia and HerzegovinaBrazilBulgariaBurma/MyanmarCabo VerdeCambodiaCameroonCanadaCaribbeanCentral AmericaChileChinaColombiaCongoCosta RicaCroatiaCubaCzechoslovakiaDenmarkDominicaDominican RepublicEastern AfricaEastern AsiaEastern EuropeEcuadorEgyptEl SalvadorEnglandEritreaEthiopiaEuropeFijiFranceGermanyGhanaGreeceGrenadaGuatemalaGuyanaHaitiHondurasHong KongHungaryIndiaIndonesiaIranIraqIrelandIsraelItalyJamaicaJapanJordanKazakhstanKenyaKoreaKuwaitLaosLatin AmericaLatviaLebanonLiberiaLithuaniaMalaysiaMexicoMicronesiaMiddle AfricaMoldovaMoroccoNepalNetherlandsNicaraguaNigeriaNorth AmericaNorth MacedoniaNorthern AfricaNorthern EuropeNorwayOceaniaPakistanPanamaPeruPhilippinesPolandPortugalRomaniaRussiaSaudi ArabiaScotlandSenegalSerbiaSierra LeoneSingaporeSomaliaSouth AfricaSouth AmericaSouth Central AsiaSouth Eastern AsiaSouthern EuropeSpainSri LankaSt. Vincent and the GrenadinesSudanSwedenSwitzerlandSyriaTaiwanThailandTrinidad and TobagoTurkeyUgandaUkraineUruguayUzbekistanVenezuelaVietnamWest IndiesWestern AfricaWestern AsiaWestern EuropeYemenZaireZimbabweAzores
Armenian
Race
Ancestry
AfghanAfricanAlaska NativeAlaskan AthabascanAlbanianAleutAlsatianAmericanApacheArabArapahoArgentineanArmenianAssyrian/Chaldean/SyriacAustralianAustrianBahamianBangladeshiBarbadianBasqueBelgianBelizeanBermudanBhutaneseBlackfeetBolivianBrazilianBritishBritish West IndianBulgarianBurmeseCajunCambodianCanadianCape VerdeanCarpatho RusynCelticCentral AmericanCentral American IndianCherokeeCheyenneChickasawChileanChineseChippewaChoctawColombianColvilleComancheCosta RicanCreeCreekCroatianCrowCubanCypriotCzechCzechoslovakianDanishDelawareDominicanDutchDutch West IndianEastern EuropeanEcuadorianEgyptianEnglishEstonianEthiopianEuropeanFijianFilipinoFinnishFrenchFrench American IndianFrench CanadianGermanGerman RussianGhanaianGreekGuamanian/ChamorroGuatemalanGuyaneseHaitianHmongHonduranHopiHoumaHungarianIcelanderIndian (Asian)IndonesianInupiatIranianIraqiIrishIroquoisIsraeliItalianJamaicanJapaneseJordanianKenyanKiowaKoreanLaotianLatvianLebaneseLithuanianLumbeeLuxembourgerMacedonianMalaysianMalteseMarshalleseMenomineeMexicanMexican American IndianMongolianMoroccanNative HawaiianNavajoNepaleseNew ZealanderNicaraguanNigerianNorthern EuropeanNorwegianOkinawanOsageOttawaPaiutePakistaniPalestinianPanamanianParaguayanPennsylvania GermanPeruvianPimaPolishPortuguesePotawatomiPuebloPuerto RicanPuget Sound SalishRomanianRussianSalvadoranSamoanScandinavianScotch-IrishScottishSeminoleSenegaleseSerbianShoshoneSierra LeoneanSiouxSlavicSlovakSloveneSomaliSouth AfricanSouth AmericanSouth American IndianSoviet UnionSpaniardSpanishSpanish AmericanSpanish American IndianSri LankanSubsaharan AfricanSudaneseSwedishSwissSyrianTaiwaneseThaiTlingit-HaidaTohono O'OdhamTonganTrinidadian and TobagonianTsimshianTurkishU.S. Virgin IslanderUgandanUkrainianUruguayanUteVenezuelanVietnameseWelshWest IndianYakamaYaquiYugoslavianYumanYup'ikZimbabwean
Immigration
NonimmigrantsImmigrantsAfghanistanAfricaAlbaniaArgentinaArmeniaAsiaAustraliaAustriaBahamasBangladeshBarbadosBelarusBelgiumBelizeBoliviaBosnia and HerzegovinaBrazilBulgariaBurma/MyanmarCabo VerdeCambodiaCameroonCanadaCaribbeanCentral AmericaChileChinaColombiaCongoCosta RicaCroatiaCubaCzechoslovakiaDenmarkDominicaDominican RepublicEastern AfricaEastern AsiaEastern EuropeEcuadorEgyptEl SalvadorEnglandEritreaEthiopiaEuropeFijiFranceGermanyGhanaGreeceGrenadaGuatemalaGuyanaHaitiHondurasHong KongHungaryIndiaIndonesiaIranIraqIrelandIsraelItalyJamaicaJapanJordanKazakhstanKenyaKoreaKuwaitLaosLatin AmericaLatviaLebanonLiberiaLithuaniaMalaysiaMexicoMicronesiaMiddle AfricaMoldovaMoroccoNepalNetherlandsNicaraguaNigeriaNorth AmericaNorth MacedoniaNorthern AfricaNorthern EuropeNorwayOceaniaPakistanPanamaPeruPhilippinesPolandPortugalRomaniaRussiaSaudi ArabiaScotlandSenegalSerbiaSierra LeoneSingaporeSomaliaSouth AfricaSouth AmericaSouth Central AsiaSouth Eastern AsiaSouthern EuropeSpainSri LankaSt. Vincent and the GrenadinesSudanSwedenSwitzerlandSyriaTaiwanThailandTrinidad and TobagoTurkeyUgandaUkraineUruguayUzbekistanVenezuelaVietnamWest IndiesWestern AfricaWestern AsiaWestern EuropeYemenZaireZimbabweAzores
Family Poverty
Income
Poverty
Unemployment
Labor Participation
Family Structure
Vehicle Availability
Education Level
Disability

Family Poverty Comparison

Liberians

Armenians

Tragic
Excellent
10.6%
FAMILY POVERTY
0.4/ 100
METRIC RATING
247th/ 347
METRIC RANK
8.5%
FAMILY POVERTY
84.6/ 100
METRIC RATING
138th/ 347
METRIC RANK

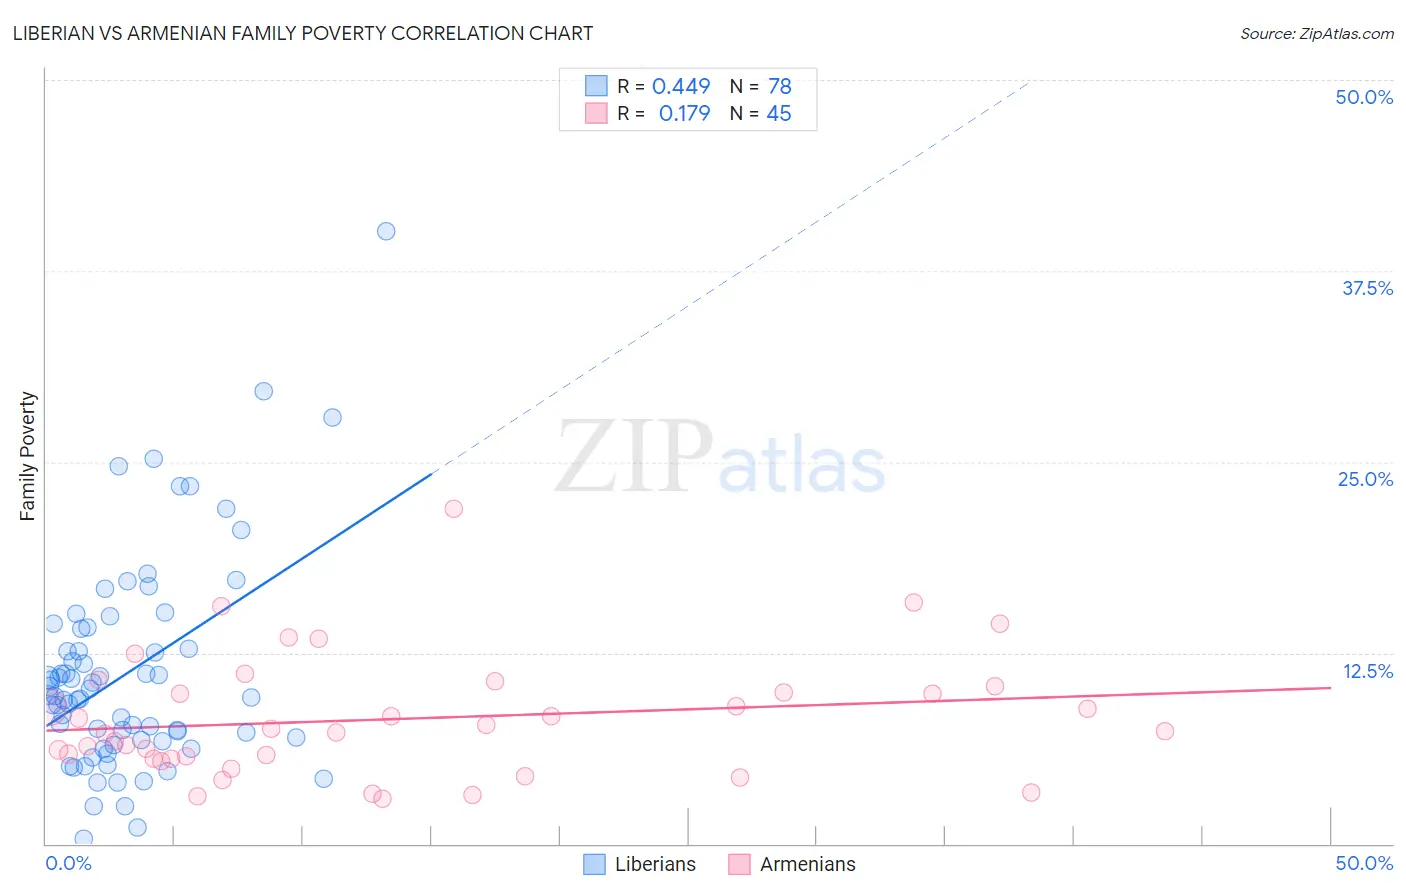
Liberian vs Armenian Family Poverty Correlation Chart

The statistical analysis conducted on geographies consisting of 117,984,513 people shows a moderate positive correlation between the proportion of Liberians and poverty level among families in the United States with a correlation coefficient (R) of 0.449 and weighted average of 10.6%. Similarly, the statistical analysis conducted on geographies consisting of 310,074,733 people shows a poor positive correlation between the proportion of Armenians and poverty level among families in the United States with a correlation coefficient (R) of 0.179 and weighted average of 8.5%, a difference of 24.7%.
Liberian vs Armenian Family Poverty

Family Poverty Correlation Summary

MeasurementLiberianArmenian
Minimum0.35%3.0%
Maximum40.1%22.0%
Range39.8%19.0%
Mean11.2%8.2%
Median9.7%7.4%
Interquartile 25% (IQ1)6.8%5.6%
Interquartile 75% (IQ3)14.0%10.1%
Interquartile Range (IQR)7.3%4.5%
Standard Deviation (Sample)6.9%4.0%
Standard Deviation (Population)6.9%3.9%

Similar Demographics by Family Poverty

Demographics Similar to Liberians by Family Poverty

In terms of family poverty, the demographic groups most similar to Liberians are Cherokee (10.6%, a difference of 0.090%), Nicaraguan (10.6%, a difference of 0.20%), Cuban (10.6%, a difference of 0.25%), Immigrants from Burma/Myanmar (10.5%, a difference of 0.73%), and Salvadoran (10.7%, a difference of 0.77%).
DemographicsRating | RankFamily Poverty
Immigrants | Azores
1.4
/100
|
#240
Tragic
10.3%
Ghanaians
1.3
/100
|
#241
Tragic
10.3%
Alaska Natives
1.0
/100
|
#242
Tragic
10.4%
Nepalese
0.8
/100
|
#243
Tragic
10.4%
Cree
0.7
/100
|
#244
Tragic
10.5%
Immigrants | Burma/Myanmar
0.6
/100
|
#245
Tragic
10.5%
Cherokee
0.5
/100
|
#246
Tragic
10.6%
Liberians
0.4
/100
|
#247
Tragic
10.6%
Nicaraguans
0.4
/100
|
#248
Tragic
10.6%
Cubans
0.4
/100
|
#249
Tragic
10.6%
Salvadorans
0.3
/100
|
#250
Tragic
10.7%
Iroquois
0.3
/100
|
#251
Tragic
10.7%
Immigrants | Zaire
0.3
/100
|
#252
Tragic
10.7%
Immigrants | Western Africa
0.3
/100
|
#253
Tragic
10.7%
Ecuadorians
0.2
/100
|
#254
Tragic
10.8%

Demographics Similar to Armenians by Family Poverty

In terms of family poverty, the demographic groups most similar to Armenians are Immigrants from Nepal (8.5%, a difference of 0.12%), Immigrants from Kazakhstan (8.5%, a difference of 0.15%), Immigrants from Ukraine (8.5%, a difference of 0.18%), Yugoslavian (8.5%, a difference of 0.30%), and Immigrants from Germany (8.5%, a difference of 0.33%).
DemographicsRating | RankFamily Poverty
Puget Sound Salish
88.6
/100
|
#131
Excellent
8.4%
Immigrants | Argentina
88.2
/100
|
#132
Excellent
8.4%
Sri Lankans
86.6
/100
|
#133
Excellent
8.5%
Chileans
86.6
/100
|
#134
Excellent
8.5%
Immigrants | Malaysia
86.5
/100
|
#135
Excellent
8.5%
Immigrants | Brazil
86.3
/100
|
#136
Excellent
8.5%
Immigrants | Southern Europe
86.0
/100
|
#137
Excellent
8.5%
Armenians
84.6
/100
|
#138
Excellent
8.5%
Immigrants | Nepal
84.2
/100
|
#139
Excellent
8.5%
Immigrants | Kazakhstan
84.1
/100
|
#140
Excellent
8.5%
Immigrants | Ukraine
83.9
/100
|
#141
Excellent
8.5%
Yugoslavians
83.5
/100
|
#142
Excellent
8.5%
Immigrants | Germany
83.3
/100
|
#143
Excellent
8.5%
Albanians
83.3
/100
|
#144
Excellent
8.5%
Immigrants | South Eastern Asia
83.2
/100
|
#145
Excellent
8.5%