Immigrants from Liberia vs Inupiat Male Poverty
COMPARE
Immigrants from Liberia
Inupiat
Male Poverty
Male Poverty Comparison
Immigrants from Liberia
Inupiat
13.0%
MALE POVERTY
0.1/ 100
METRIC RATING
255th/ 347
METRIC RANK
14.0%
MALE POVERTY
0.0/ 100
METRIC RATING
297th/ 347
METRIC RANK
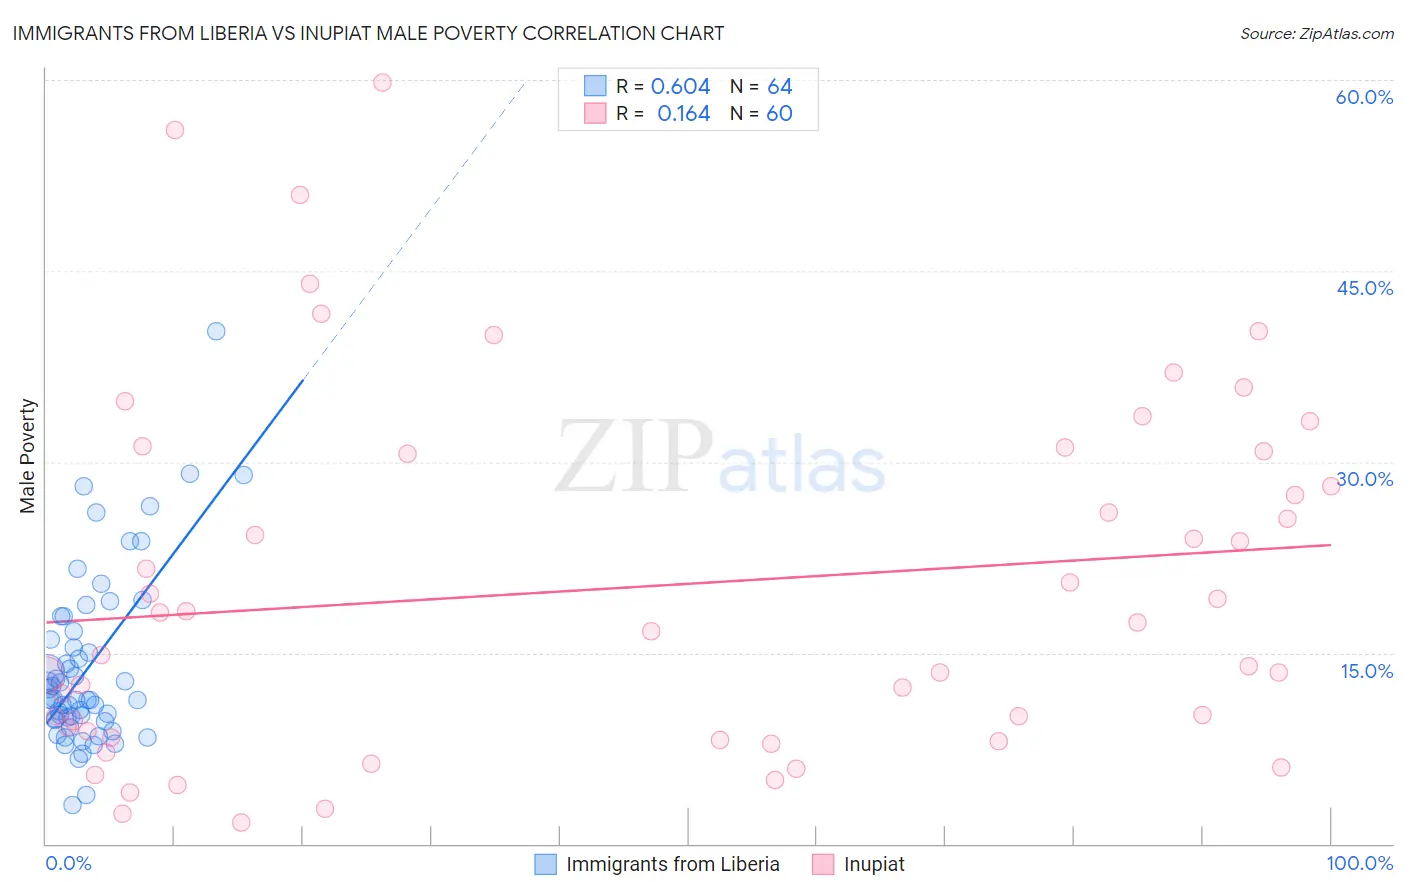
Immigrants from Liberia vs Inupiat Male Poverty Correlation Chart
The statistical analysis conducted on geographies consisting of 135,246,514 people shows a significant positive correlation between the proportion of Immigrants from Liberia and poverty level among males in the United States with a correlation coefficient (R) of 0.604 and weighted average of 13.0%. Similarly, the statistical analysis conducted on geographies consisting of 96,314,568 people shows a poor positive correlation between the proportion of Inupiat and poverty level among males in the United States with a correlation coefficient (R) of 0.164 and weighted average of 14.0%, a difference of 7.7%.
Male Poverty Correlation Summary
| Measurement | Immigrants from Liberia | Inupiat |
| Minimum | 3.0% | 1.7% |
| Maximum | 40.3% | 59.8% |
| Range | 37.2% | 58.1% |
| Mean | 13.8% | 20.1% |
| Median | 11.4% | 17.0% |
| Interquartile 25% (IQ1) | 9.8% | 8.6% |
| Interquartile 75% (IQ3) | 16.4% | 30.7% |
| Interquartile Range (IQR) | 6.6% | 22.1% |
| Standard Deviation (Sample) | 6.8% | 14.1% |
| Standard Deviation (Population) | 6.8% | 14.0% |
Similar Demographics by Male Poverty
Demographics Similar to Immigrants from Liberia by Male Poverty
In terms of male poverty, the demographic groups most similar to Immigrants from Liberia are Mexican American Indian (13.0%, a difference of 0.090%), Immigrants from Burma/Myanmar (13.0%, a difference of 0.20%), Immigrants from Ghana (12.9%, a difference of 0.47%), Immigrants from Trinidad and Tobago (13.1%, a difference of 0.47%), and Immigrants from Ecuador (12.9%, a difference of 0.53%).
| Demographics | Rating | Rank | Male Poverty |
| Immigrants | Sudan | 0.2 /100 | #248 | Tragic 12.9% |
| Potawatomi | 0.2 /100 | #249 | Tragic 12.9% |
| Immigrants | Nicaragua | 0.2 /100 | #250 | Tragic 12.9% |
| Immigrants | Cuba | 0.2 /100 | #251 | Tragic 12.9% |
| Immigrants | Ecuador | 0.2 /100 | #252 | Tragic 12.9% |
| Immigrants | Ghana | 0.2 /100 | #253 | Tragic 12.9% |
| Mexican American Indians | 0.1 /100 | #254 | Tragic 13.0% |
| Immigrants | Liberia | 0.1 /100 | #255 | Tragic 13.0% |
| Immigrants | Burma/Myanmar | 0.1 /100 | #256 | Tragic 13.0% |
| Immigrants | Trinidad and Tobago | 0.1 /100 | #257 | Tragic 13.1% |
| Cape Verdeans | 0.1 /100 | #258 | Tragic 13.1% |
| Cherokee | 0.1 /100 | #259 | Tragic 13.1% |
| Ottawa | 0.1 /100 | #260 | Tragic 13.1% |
| Trinidadians and Tobagonians | 0.1 /100 | #261 | Tragic 13.1% |
| Spanish American Indians | 0.1 /100 | #262 | Tragic 13.1% |
Demographics Similar to Inupiat by Male Poverty
In terms of male poverty, the demographic groups most similar to Inupiat are Blackfeet (14.0%, a difference of 0.030%), Immigrants from Guatemala (14.0%, a difference of 0.13%), Immigrants from Mexico (14.0%, a difference of 0.25%), Immigrants from Senegal (14.0%, a difference of 0.32%), and Immigrants from Caribbean (14.0%, a difference of 0.37%).
| Demographics | Rating | Rank | Male Poverty |
| Immigrants | Zaire | 0.0 /100 | #290 | Tragic 13.8% |
| Vietnamese | 0.0 /100 | #291 | Tragic 13.8% |
| Indonesians | 0.0 /100 | #292 | Tragic 13.8% |
| Immigrants | Belize | 0.0 /100 | #293 | Tragic 13.8% |
| Hispanics or Latinos | 0.0 /100 | #294 | Tragic 13.9% |
| Immigrants | Central America | 0.0 /100 | #295 | Tragic 13.9% |
| Cajuns | 0.0 /100 | #296 | Tragic 13.9% |
| Inupiat | 0.0 /100 | #297 | Tragic 14.0% |
| Blackfeet | 0.0 /100 | #298 | Tragic 14.0% |
| Immigrants | Guatemala | 0.0 /100 | #299 | Tragic 14.0% |
| Immigrants | Mexico | 0.0 /100 | #300 | Tragic 14.0% |
| Immigrants | Senegal | 0.0 /100 | #301 | Tragic 14.0% |
| Immigrants | Caribbean | 0.0 /100 | #302 | Tragic 14.0% |
| Bahamians | 0.0 /100 | #303 | Tragic 14.1% |
| Senegalese | 0.0 /100 | #304 | Tragic 14.1% |