Nonimmigrants vs Sierra Leonean Poverty
COMPARE
Nonimmigrants
Sierra Leonean
Poverty
Poverty Comparison
Nonimmigrants
Sierra Leoneans
13.3%
POVERTY
3.3/ 100
METRIC RATING
216th/ 347
METRIC RANK
12.6%
POVERTY
31.5/ 100
METRIC RATING
191st/ 347
METRIC RANK
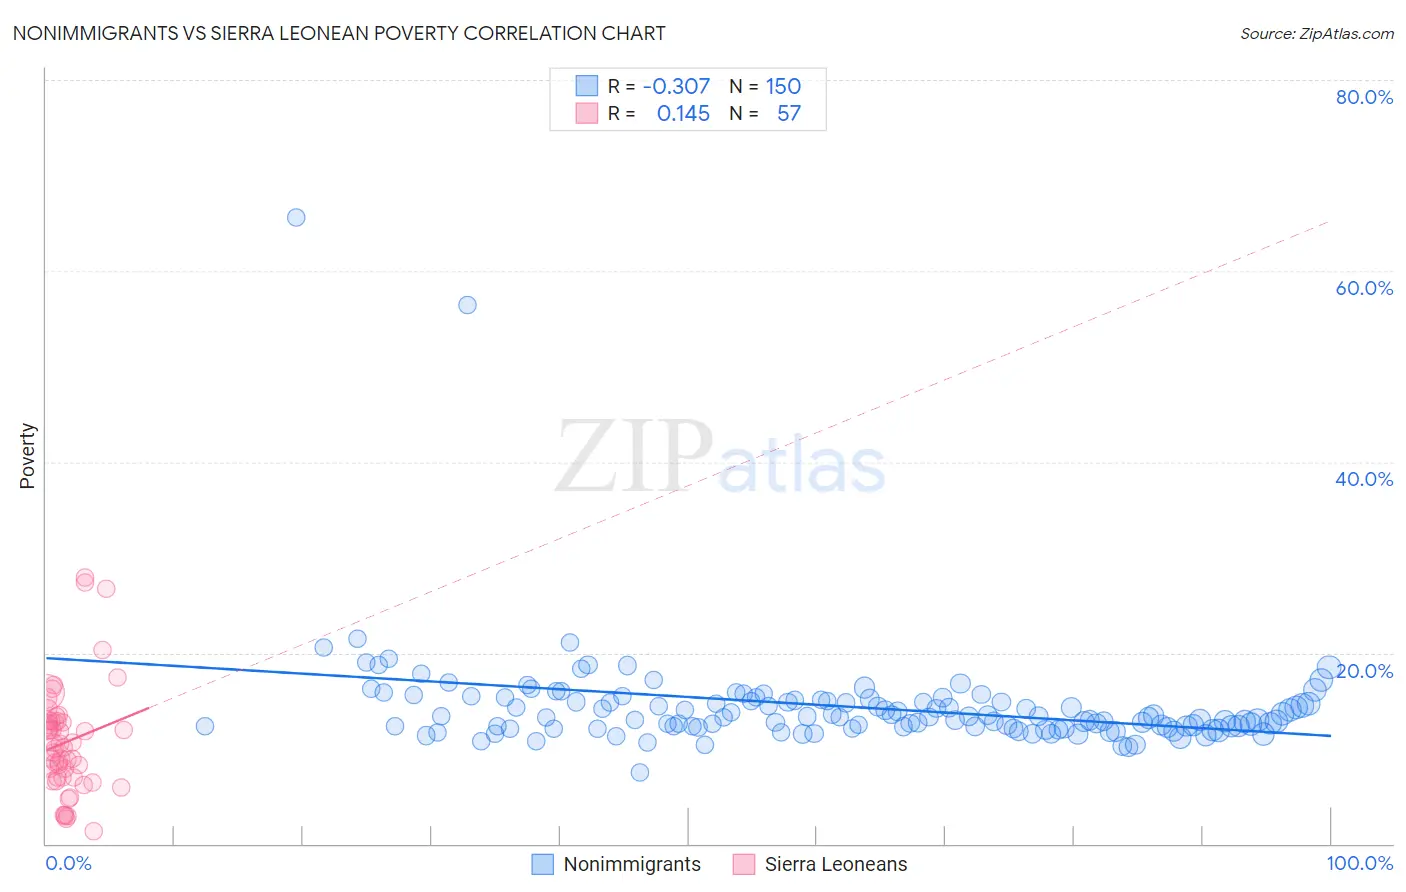
Nonimmigrants vs Sierra Leonean Poverty Correlation Chart
The statistical analysis conducted on geographies consisting of 583,909,037 people shows a mild negative correlation between the proportion of Nonimmigrants and poverty level in the United States with a correlation coefficient (R) of -0.307 and weighted average of 13.3%. Similarly, the statistical analysis conducted on geographies consisting of 83,348,964 people shows a poor positive correlation between the proportion of Sierra Leoneans and poverty level in the United States with a correlation coefficient (R) of 0.145 and weighted average of 12.6%, a difference of 6.2%.
Poverty Correlation Summary
| Measurement | Nonimmigrants | Sierra Leonean |
| Minimum | 7.5% | 1.3% |
| Maximum | 65.6% | 27.9% |
| Range | 58.1% | 26.7% |
| Mean | 14.4% | 10.7% |
| Median | 13.3% | 10.1% |
| Interquartile 25% (IQ1) | 12.2% | 6.9% |
| Interquartile 75% (IQ3) | 15.0% | 12.8% |
| Interquartile Range (IQR) | 2.7% | 5.9% |
| Standard Deviation (Sample) | 5.9% | 5.7% |
| Standard Deviation (Population) | 5.9% | 5.6% |
Similar Demographics by Poverty
Demographics Similar to Nonimmigrants by Poverty
In terms of poverty, the demographic groups most similar to Nonimmigrants are Japanese (13.3%, a difference of 0.0%), Immigrants from Uzbekistan (13.3%, a difference of 0.040%), Immigrants from Thailand (13.3%, a difference of 0.10%), Immigrants from Cambodia (13.4%, a difference of 0.23%), and Bermudan (13.3%, a difference of 0.26%).
| Demographics | Rating | Rank | Poverty |
| Malaysians | 6.1 /100 | #209 | Tragic 13.1% |
| Immigrants | Azores | 6.1 /100 | #210 | Tragic 13.1% |
| Moroccans | 5.2 /100 | #211 | Tragic 13.2% |
| Immigrants | Immigrants | 4.3 /100 | #212 | Tragic 13.2% |
| Immigrants | Panama | 4.1 /100 | #213 | Tragic 13.3% |
| Bermudans | 3.7 /100 | #214 | Tragic 13.3% |
| Japanese | 3.3 /100 | #215 | Tragic 13.3% |
| Immigrants | Nonimmigrants | 3.3 /100 | #216 | Tragic 13.3% |
| Immigrants | Uzbekistan | 3.2 /100 | #217 | Tragic 13.3% |
| Immigrants | Thailand | 3.1 /100 | #218 | Tragic 13.3% |
| Immigrants | Cambodia | 3.0 /100 | #219 | Tragic 13.4% |
| Americans | 2.9 /100 | #220 | Tragic 13.4% |
| Alsatians | 2.6 /100 | #221 | Tragic 13.4% |
| Immigrants | Micronesia | 2.6 /100 | #222 | Tragic 13.4% |
| Immigrants | Africa | 2.5 /100 | #223 | Tragic 13.4% |
Demographics Similar to Sierra Leoneans by Poverty
In terms of poverty, the demographic groups most similar to Sierra Leoneans are Immigrants from South America (12.5%, a difference of 0.10%), Aleut (12.5%, a difference of 0.19%), Immigrants from Costa Rica (12.5%, a difference of 0.20%), Hawaiian (12.5%, a difference of 0.29%), and Immigrants from Sierra Leone (12.5%, a difference of 0.51%).
| Demographics | Rating | Rank | Poverty |
| Kenyans | 38.8 /100 | #184 | Fair 12.5% |
| Israelis | 36.4 /100 | #185 | Fair 12.5% |
| Immigrants | Sierra Leone | 36.3 /100 | #186 | Fair 12.5% |
| Hawaiians | 34.1 /100 | #187 | Fair 12.5% |
| Immigrants | Costa Rica | 33.3 /100 | #188 | Fair 12.5% |
| Aleuts | 33.2 /100 | #189 | Fair 12.5% |
| Immigrants | South America | 32.3 /100 | #190 | Fair 12.5% |
| Sierra Leoneans | 31.5 /100 | #191 | Fair 12.6% |
| South American Indians | 23.3 /100 | #192 | Fair 12.7% |
| Delaware | 21.4 /100 | #193 | Fair 12.7% |
| Arabs | 21.1 /100 | #194 | Fair 12.7% |
| Immigrants | Kuwait | 20.9 /100 | #195 | Fair 12.7% |
| Iraqis | 20.8 /100 | #196 | Fair 12.7% |
| Immigrants | Lebanon | 18.7 /100 | #197 | Poor 12.8% |
| Spanish | 18.7 /100 | #198 | Poor 12.8% |