Nigerian vs Immigrants from Latvia Single Mother Poverty
COMPARE
Nigerian
Immigrants from Latvia
Single Mother Poverty
Single Mother Poverty Comparison
Nigerians
Immigrants from Latvia
29.3%
SINGLE MOTHER POVERTY
38.0/ 100
METRIC RATING
184th/ 347
METRIC RANK
27.7%
SINGLE MOTHER POVERTY
98.7/ 100
METRIC RATING
84th/ 347
METRIC RANK
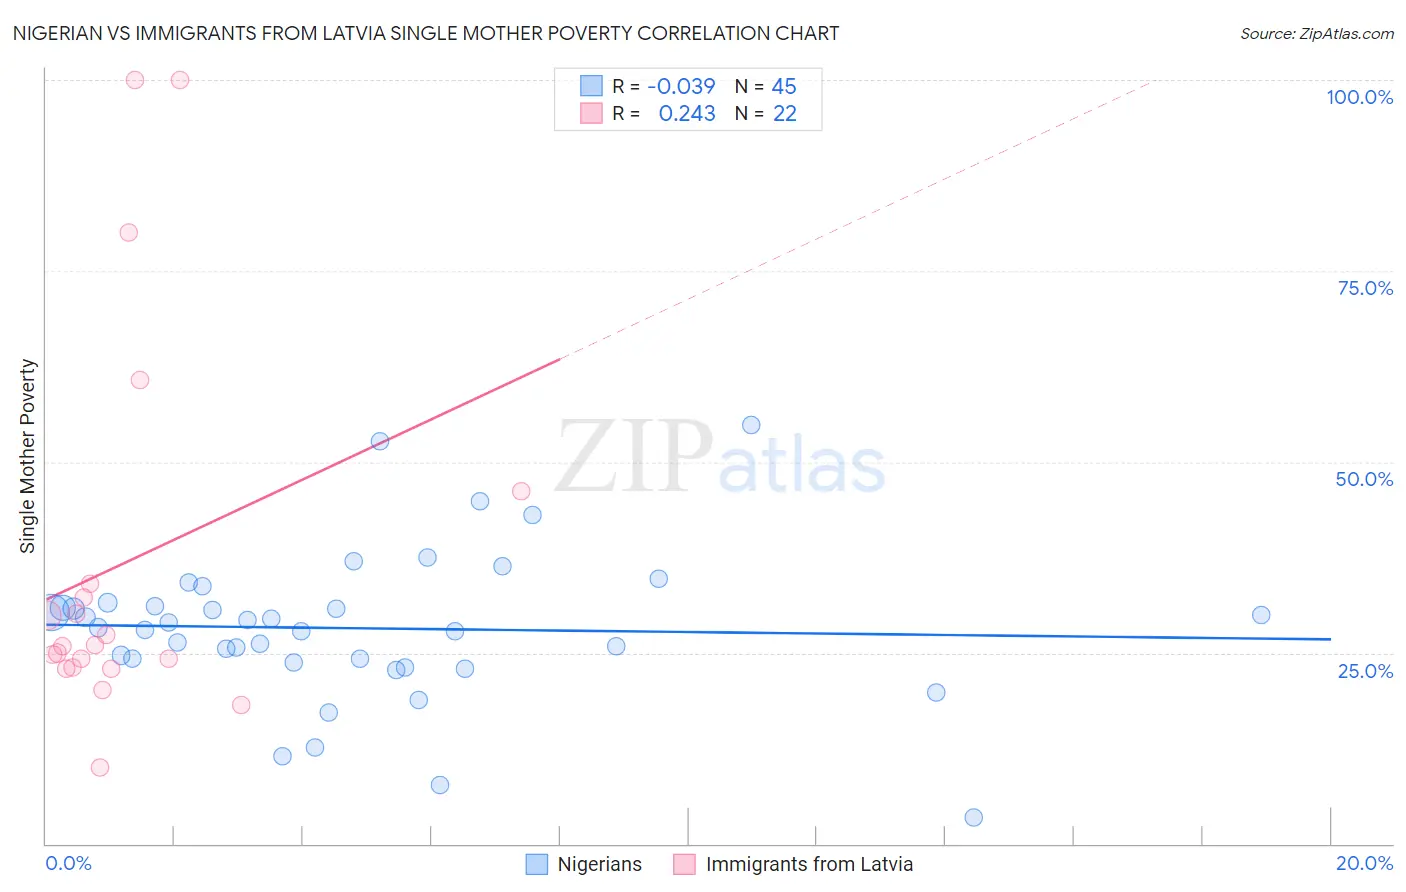
Nigerian vs Immigrants from Latvia Single Mother Poverty Correlation Chart
The statistical analysis conducted on geographies consisting of 328,233,432 people shows no correlation between the proportion of Nigerians and poverty level among single mothers in the United States with a correlation coefficient (R) of -0.039 and weighted average of 29.3%. Similarly, the statistical analysis conducted on geographies consisting of 112,466,878 people shows a weak positive correlation between the proportion of Immigrants from Latvia and poverty level among single mothers in the United States with a correlation coefficient (R) of 0.243 and weighted average of 27.7%, a difference of 6.0%.
Single Mother Poverty Correlation Summary
| Measurement | Nigerian | Immigrants from Latvia |
| Minimum | 3.4% | 9.9% |
| Maximum | 54.8% | 100.0% |
| Range | 51.3% | 90.1% |
| Mean | 28.2% | 36.7% |
| Median | 28.3% | 26.0% |
| Interquartile 25% (IQ1) | 24.0% | 23.0% |
| Interquartile 75% (IQ3) | 31.3% | 34.1% |
| Interquartile Range (IQR) | 7.4% | 11.1% |
| Standard Deviation (Sample) | 9.8% | 25.3% |
| Standard Deviation (Population) | 9.7% | 24.8% |
Similar Demographics by Single Mother Poverty
Demographics Similar to Nigerians by Single Mother Poverty
In terms of single mother poverty, the demographic groups most similar to Nigerians are Nepalese (29.3%, a difference of 0.010%), Immigrants from Eastern Africa (29.3%, a difference of 0.030%), Ghanaian (29.4%, a difference of 0.060%), Yugoslavian (29.4%, a difference of 0.10%), and Canadian (29.3%, a difference of 0.12%).
| Demographics | Rating | Rank | Single Mother Poverty |
| Immigrants | Bosnia and Herzegovina | 45.1 /100 | #177 | Average 29.2% |
| South American Indians | 43.2 /100 | #178 | Average 29.3% |
| Immigrants | Uzbekistan | 42.6 /100 | #179 | Average 29.3% |
| Immigrants | Norway | 41.5 /100 | #180 | Average 29.3% |
| Canadians | 40.4 /100 | #181 | Average 29.3% |
| Immigrants | Eastern Africa | 38.5 /100 | #182 | Fair 29.3% |
| Nepalese | 38.3 /100 | #183 | Fair 29.3% |
| Nigerians | 38.0 /100 | #184 | Fair 29.3% |
| Ghanaians | 36.8 /100 | #185 | Fair 29.4% |
| Yugoslavians | 36.0 /100 | #186 | Fair 29.4% |
| Lebanese | 32.5 /100 | #187 | Fair 29.4% |
| Guamanians/Chamorros | 31.8 /100 | #188 | Fair 29.4% |
| Immigrants | Africa | 31.6 /100 | #189 | Fair 29.4% |
| Immigrants | Germany | 30.4 /100 | #190 | Fair 29.5% |
| Immigrants | Trinidad and Tobago | 29.2 /100 | #191 | Fair 29.5% |
Demographics Similar to Immigrants from Latvia by Single Mother Poverty
In terms of single mother poverty, the demographic groups most similar to Immigrants from Latvia are Mongolian (27.7%, a difference of 0.0%), Greek (27.7%, a difference of 0.030%), Immigrants from Cameroon (27.6%, a difference of 0.090%), Immigrants from Ukraine (27.7%, a difference of 0.10%), and Afghan (27.7%, a difference of 0.20%).
| Demographics | Rating | Rank | Single Mother Poverty |
| Immigrants | Peru | 99.2 /100 | #77 | Exceptional 27.5% |
| Immigrants | North Macedonia | 99.2 /100 | #78 | Exceptional 27.5% |
| Immigrants | Italy | 99.1 /100 | #79 | Exceptional 27.5% |
| Taiwanese | 99.1 /100 | #80 | Exceptional 27.5% |
| Immigrants | Scotland | 98.9 /100 | #81 | Exceptional 27.6% |
| Immigrants | Cameroon | 98.8 /100 | #82 | Exceptional 27.6% |
| Greeks | 98.7 /100 | #83 | Exceptional 27.7% |
| Immigrants | Latvia | 98.7 /100 | #84 | Exceptional 27.7% |
| Mongolians | 98.7 /100 | #85 | Exceptional 27.7% |
| Immigrants | Ukraine | 98.6 /100 | #86 | Exceptional 27.7% |
| Afghans | 98.5 /100 | #87 | Exceptional 27.7% |
| Ethiopians | 98.4 /100 | #88 | Exceptional 27.7% |
| Immigrants | Ethiopia | 98.4 /100 | #89 | Exceptional 27.7% |
| Immigrants | France | 98.2 /100 | #90 | Exceptional 27.8% |
| Immigrants | Albania | 98.0 /100 | #91 | Exceptional 27.8% |