Immigrants from Brazil vs Immigrants from Latvia Single Mother Poverty
COMPARE
Immigrants from Brazil
Immigrants from Latvia
Single Mother Poverty
Single Mother Poverty Comparison
Immigrants from Brazil
Immigrants from Latvia
27.9%
SINGLE MOTHER POVERTY
97.2/ 100
METRIC RATING
97th/ 347
METRIC RANK
27.7%
SINGLE MOTHER POVERTY
98.7/ 100
METRIC RATING
84th/ 347
METRIC RANK
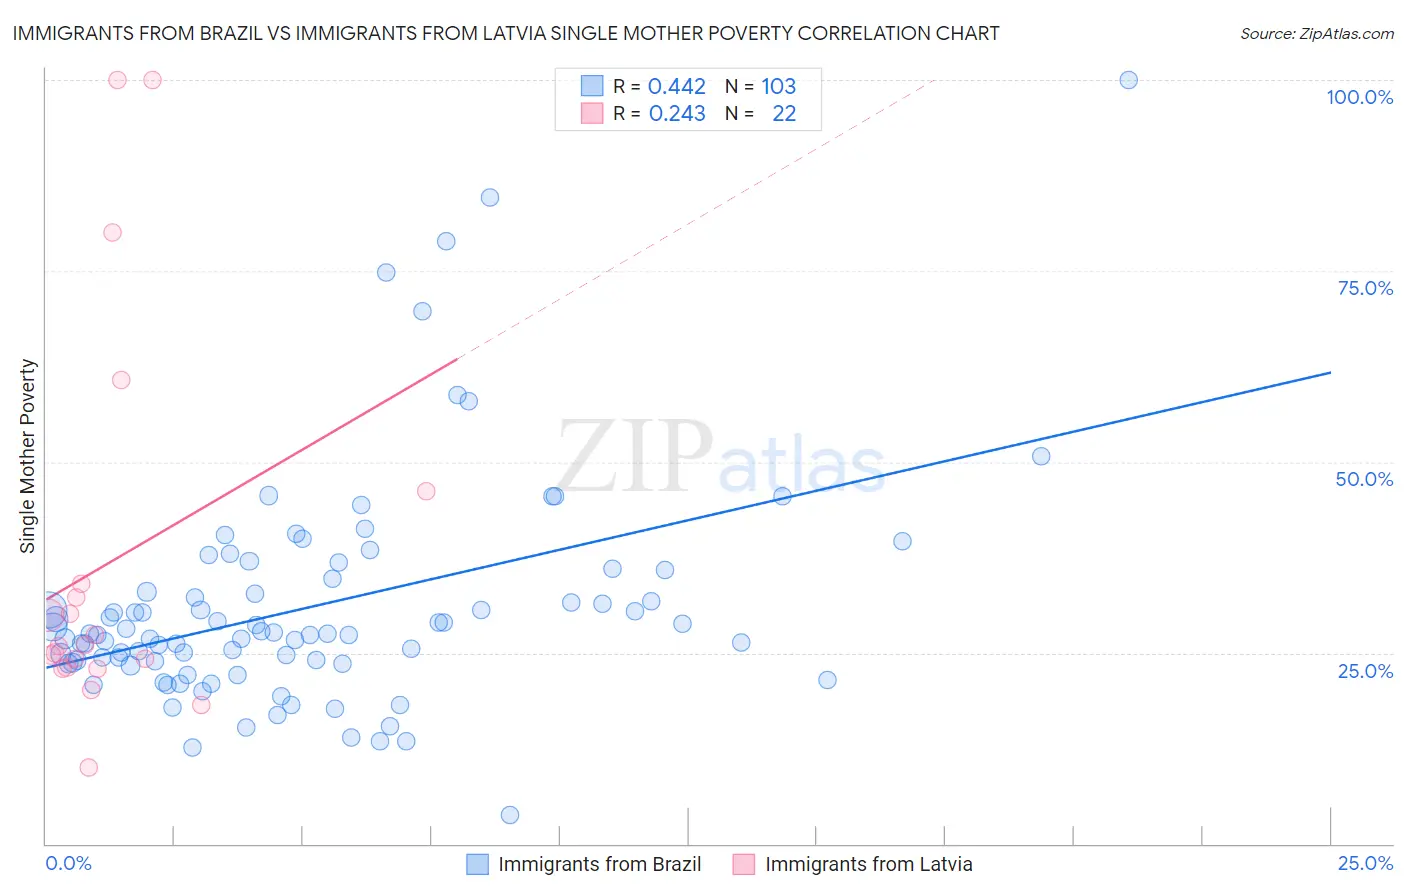
Immigrants from Brazil vs Immigrants from Latvia Single Mother Poverty Correlation Chart
The statistical analysis conducted on geographies consisting of 334,860,150 people shows a moderate positive correlation between the proportion of Immigrants from Brazil and poverty level among single mothers in the United States with a correlation coefficient (R) of 0.442 and weighted average of 27.9%. Similarly, the statistical analysis conducted on geographies consisting of 112,466,878 people shows a weak positive correlation between the proportion of Immigrants from Latvia and poverty level among single mothers in the United States with a correlation coefficient (R) of 0.243 and weighted average of 27.7%, a difference of 0.94%.
Single Mother Poverty Correlation Summary
| Measurement | Immigrants from Brazil | Immigrants from Latvia |
| Minimum | 3.8% | 9.9% |
| Maximum | 100.0% | 100.0% |
| Range | 96.2% | 90.1% |
| Mean | 31.0% | 36.7% |
| Median | 27.5% | 26.0% |
| Interquartile 25% (IQ1) | 23.7% | 23.0% |
| Interquartile 75% (IQ3) | 34.7% | 34.1% |
| Interquartile Range (IQR) | 11.1% | 11.1% |
| Standard Deviation (Sample) | 14.8% | 25.3% |
| Standard Deviation (Population) | 14.7% | 24.8% |
Demographics Similar to Immigrants from Brazil and Immigrants from Latvia by Single Mother Poverty
In terms of single mother poverty, the demographic groups most similar to Immigrants from Brazil are Immigrants from Nepal (27.9%, a difference of 0.010%), Immigrants from Netherlands (27.9%, a difference of 0.020%), Immigrants from Iraq (27.9%, a difference of 0.040%), Zimbabwean (27.9%, a difference of 0.070%), and Chilean (27.9%, a difference of 0.14%). Similarly, the demographic groups most similar to Immigrants from Latvia are Mongolian (27.7%, a difference of 0.0%), Greek (27.7%, a difference of 0.030%), Immigrants from Cameroon (27.6%, a difference of 0.090%), Immigrants from Ukraine (27.7%, a difference of 0.10%), and Afghan (27.7%, a difference of 0.20%).
| Demographics | Rating | Rank | Single Mother Poverty |
| Taiwanese | 99.1 /100 | #80 | Exceptional 27.5% |
| Immigrants | Scotland | 98.9 /100 | #81 | Exceptional 27.6% |
| Immigrants | Cameroon | 98.8 /100 | #82 | Exceptional 27.6% |
| Greeks | 98.7 /100 | #83 | Exceptional 27.7% |
| Immigrants | Latvia | 98.7 /100 | #84 | Exceptional 27.7% |
| Mongolians | 98.7 /100 | #85 | Exceptional 27.7% |
| Immigrants | Ukraine | 98.6 /100 | #86 | Exceptional 27.7% |
| Afghans | 98.5 /100 | #87 | Exceptional 27.7% |
| Ethiopians | 98.4 /100 | #88 | Exceptional 27.7% |
| Immigrants | Ethiopia | 98.4 /100 | #89 | Exceptional 27.7% |
| Immigrants | France | 98.2 /100 | #90 | Exceptional 27.8% |
| Immigrants | Albania | 98.0 /100 | #91 | Exceptional 27.8% |
| Estonians | 97.9 /100 | #92 | Exceptional 27.8% |
| Romanians | 97.8 /100 | #93 | Exceptional 27.8% |
| Albanians | 97.6 /100 | #94 | Exceptional 27.9% |
| Chileans | 97.5 /100 | #95 | Exceptional 27.9% |
| Immigrants | Iraq | 97.3 /100 | #96 | Exceptional 27.9% |
| Immigrants | Brazil | 97.2 /100 | #97 | Exceptional 27.9% |
| Immigrants | Nepal | 97.2 /100 | #98 | Exceptional 27.9% |
| Immigrants | Netherlands | 97.2 /100 | #99 | Exceptional 27.9% |
| Zimbabweans | 97.1 /100 | #100 | Exceptional 27.9% |