Nigerian vs Immigrants from North America Single Mother Poverty
COMPARE
Nigerian
Immigrants from North America
Single Mother Poverty
Single Mother Poverty Comparison
Nigerians
Immigrants from North America
29.3%
SINGLE MOTHER POVERTY
38.0/ 100
METRIC RATING
184th/ 347
METRIC RANK
28.5%
SINGLE MOTHER POVERTY
86.5/ 100
METRIC RATING
143rd/ 347
METRIC RANK
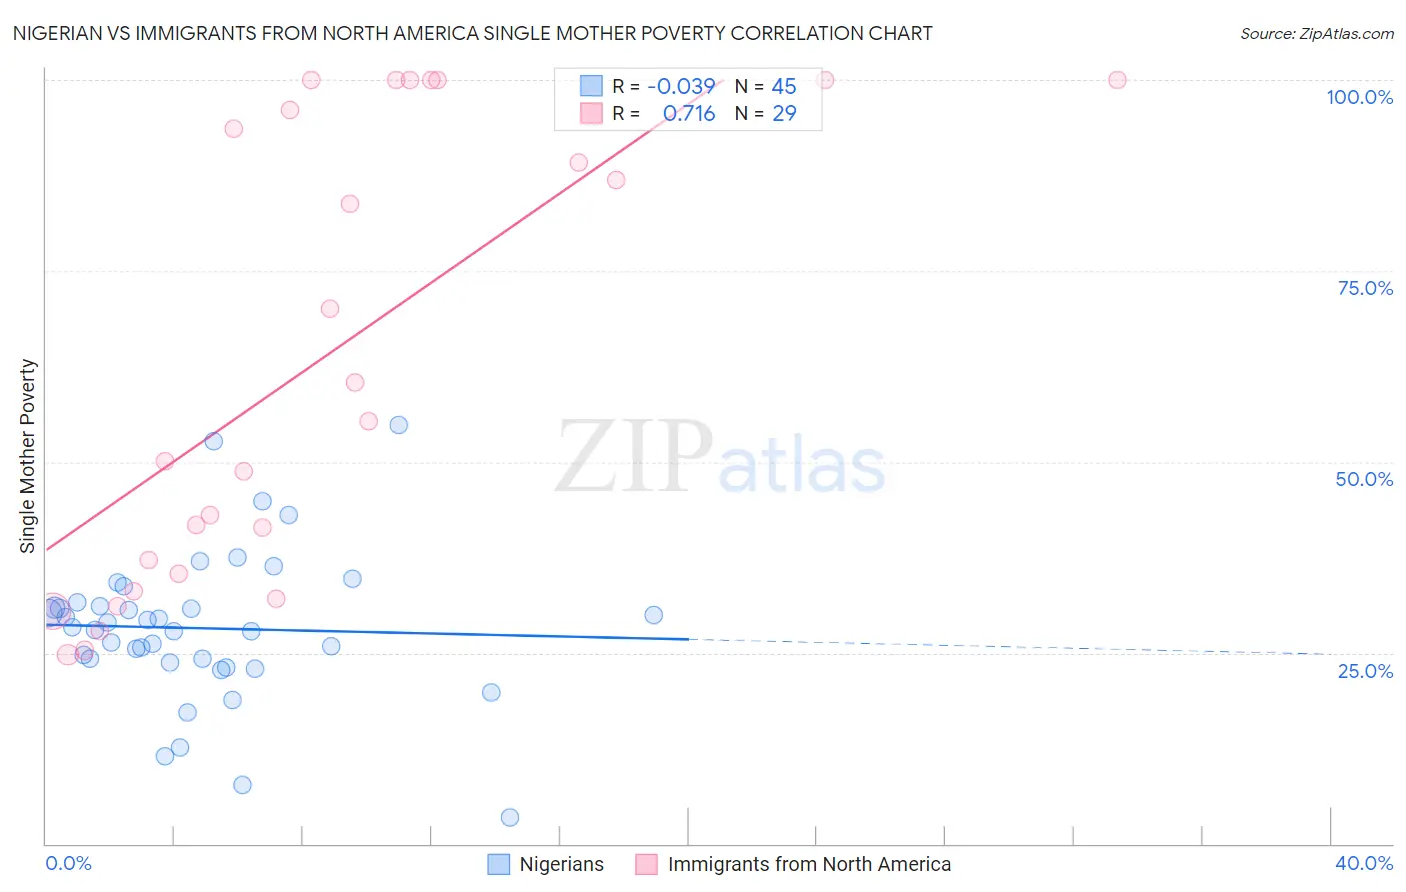
Nigerian vs Immigrants from North America Single Mother Poverty Correlation Chart
The statistical analysis conducted on geographies consisting of 328,233,432 people shows no correlation between the proportion of Nigerians and poverty level among single mothers in the United States with a correlation coefficient (R) of -0.039 and weighted average of 29.3%. Similarly, the statistical analysis conducted on geographies consisting of 446,488,890 people shows a strong positive correlation between the proportion of Immigrants from North America and poverty level among single mothers in the United States with a correlation coefficient (R) of 0.716 and weighted average of 28.5%, a difference of 2.9%.
Single Mother Poverty Correlation Summary
| Measurement | Nigerian | Immigrants from North America |
| Minimum | 3.4% | 24.7% |
| Maximum | 54.8% | 100.0% |
| Range | 51.3% | 75.3% |
| Mean | 28.2% | 63.4% |
| Median | 28.3% | 55.4% |
| Interquartile 25% (IQ1) | 24.0% | 34.3% |
| Interquartile 75% (IQ3) | 31.3% | 98.0% |
| Interquartile Range (IQR) | 7.4% | 63.8% |
| Standard Deviation (Sample) | 9.8% | 29.6% |
| Standard Deviation (Population) | 9.7% | 29.1% |
Similar Demographics by Single Mother Poverty
Demographics Similar to Nigerians by Single Mother Poverty
In terms of single mother poverty, the demographic groups most similar to Nigerians are Nepalese (29.3%, a difference of 0.010%), Immigrants from Eastern Africa (29.3%, a difference of 0.030%), Ghanaian (29.4%, a difference of 0.060%), Yugoslavian (29.4%, a difference of 0.10%), and Canadian (29.3%, a difference of 0.12%).
| Demographics | Rating | Rank | Single Mother Poverty |
| Immigrants | Bosnia and Herzegovina | 45.1 /100 | #177 | Average 29.2% |
| South American Indians | 43.2 /100 | #178 | Average 29.3% |
| Immigrants | Uzbekistan | 42.6 /100 | #179 | Average 29.3% |
| Immigrants | Norway | 41.5 /100 | #180 | Average 29.3% |
| Canadians | 40.4 /100 | #181 | Average 29.3% |
| Immigrants | Eastern Africa | 38.5 /100 | #182 | Fair 29.3% |
| Nepalese | 38.3 /100 | #183 | Fair 29.3% |
| Nigerians | 38.0 /100 | #184 | Fair 29.3% |
| Ghanaians | 36.8 /100 | #185 | Fair 29.4% |
| Yugoslavians | 36.0 /100 | #186 | Fair 29.4% |
| Lebanese | 32.5 /100 | #187 | Fair 29.4% |
| Guamanians/Chamorros | 31.8 /100 | #188 | Fair 29.4% |
| Immigrants | Africa | 31.6 /100 | #189 | Fair 29.4% |
| Immigrants | Germany | 30.4 /100 | #190 | Fair 29.5% |
| Immigrants | Trinidad and Tobago | 29.2 /100 | #191 | Fair 29.5% |
Demographics Similar to Immigrants from North America by Single Mother Poverty
In terms of single mother poverty, the demographic groups most similar to Immigrants from North America are South African (28.5%, a difference of 0.010%), Luxembourger (28.5%, a difference of 0.010%), Immigrants from South America (28.5%, a difference of 0.040%), Immigrants from Denmark (28.5%, a difference of 0.050%), and Danish (28.5%, a difference of 0.060%).
| Demographics | Rating | Rank | Single Mother Poverty |
| Native Hawaiians | 88.9 /100 | #136 | Excellent 28.4% |
| Immigrants | Canada | 88.9 /100 | #137 | Excellent 28.4% |
| Immigrants | Belgium | 88.5 /100 | #138 | Excellent 28.5% |
| Samoans | 88.1 /100 | #139 | Excellent 28.5% |
| Immigrants | Colombia | 88.0 /100 | #140 | Excellent 28.5% |
| Danes | 87.1 /100 | #141 | Excellent 28.5% |
| South Africans | 86.6 /100 | #142 | Excellent 28.5% |
| Immigrants | North America | 86.5 /100 | #143 | Excellent 28.5% |
| Luxembourgers | 86.4 /100 | #144 | Excellent 28.5% |
| Immigrants | South America | 86.1 /100 | #145 | Excellent 28.5% |
| Immigrants | Denmark | 86.1 /100 | #146 | Excellent 28.5% |
| Immigrants | Lebanon | 85.3 /100 | #147 | Excellent 28.6% |
| Syrians | 85.3 /100 | #148 | Excellent 28.6% |
| Serbians | 85.0 /100 | #149 | Excellent 28.6% |
| Northern Europeans | 81.7 /100 | #150 | Excellent 28.6% |