Nigerian vs Tongan Single Mother Poverty
COMPARE
Nigerian
Tongan
Single Mother Poverty
Single Mother Poverty Comparison
Nigerians
Tongans
29.3%
SINGLE MOTHER POVERTY
38.0/ 100
METRIC RATING
184th/ 347
METRIC RANK
26.5%
SINGLE MOTHER POVERTY
99.9/ 100
METRIC RATING
32nd/ 347
METRIC RANK
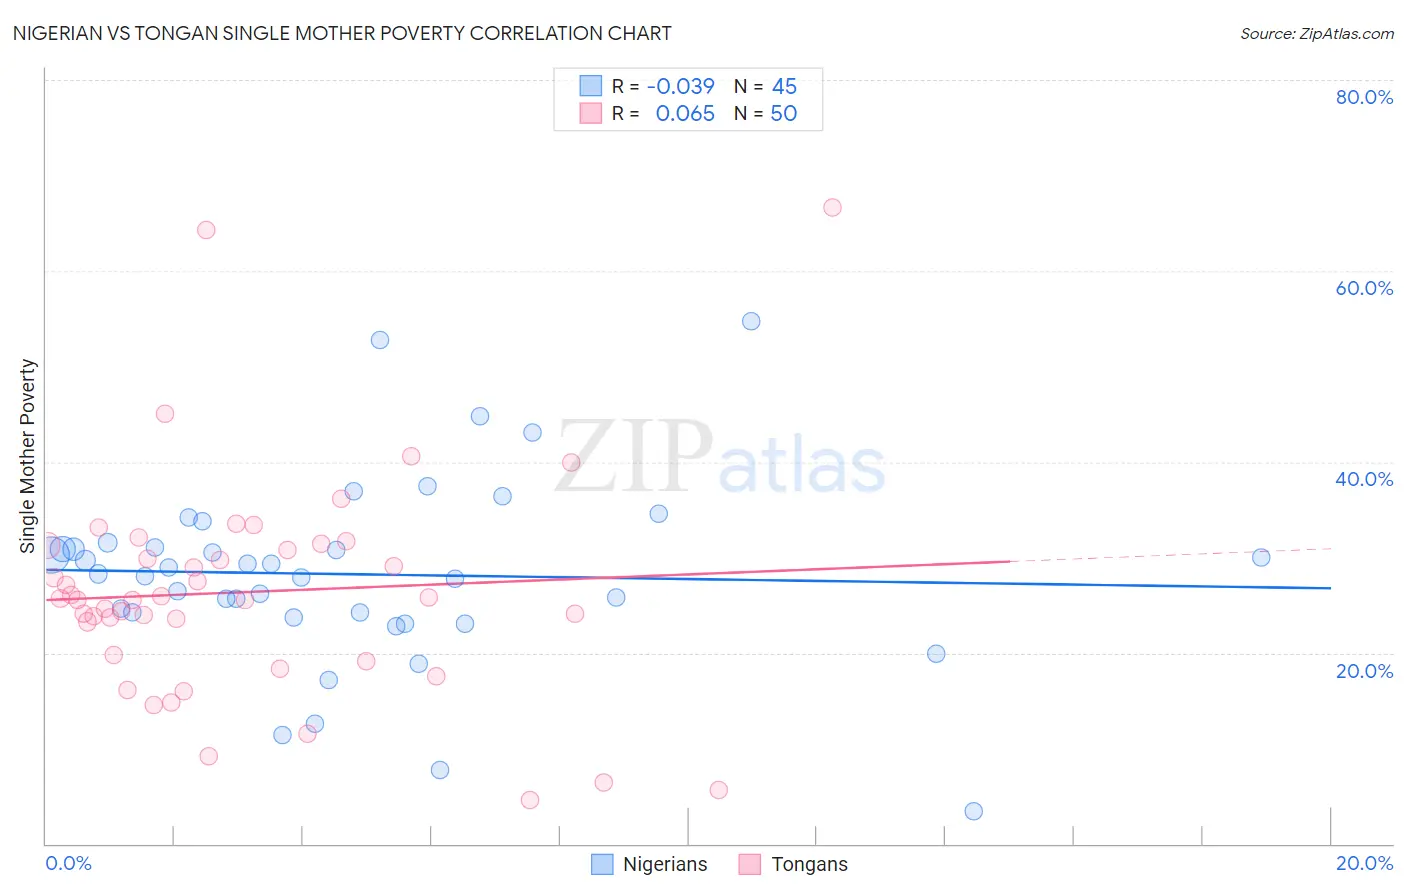
Nigerian vs Tongan Single Mother Poverty Correlation Chart
The statistical analysis conducted on geographies consisting of 328,233,432 people shows no correlation between the proportion of Nigerians and poverty level among single mothers in the United States with a correlation coefficient (R) of -0.039 and weighted average of 29.3%. Similarly, the statistical analysis conducted on geographies consisting of 102,184,509 people shows a slight positive correlation between the proportion of Tongans and poverty level among single mothers in the United States with a correlation coefficient (R) of 0.065 and weighted average of 26.5%, a difference of 10.5%.
Single Mother Poverty Correlation Summary
| Measurement | Nigerian | Tongan |
| Minimum | 3.4% | 4.6% |
| Maximum | 54.8% | 66.7% |
| Range | 51.3% | 62.1% |
| Mean | 28.2% | 26.4% |
| Median | 28.3% | 25.6% |
| Interquartile 25% (IQ1) | 24.0% | 19.8% |
| Interquartile 75% (IQ3) | 31.3% | 31.3% |
| Interquartile Range (IQR) | 7.4% | 11.5% |
| Standard Deviation (Sample) | 9.8% | 11.8% |
| Standard Deviation (Population) | 9.7% | 11.7% |
Similar Demographics by Single Mother Poverty
Demographics Similar to Nigerians by Single Mother Poverty
In terms of single mother poverty, the demographic groups most similar to Nigerians are Nepalese (29.3%, a difference of 0.010%), Immigrants from Eastern Africa (29.3%, a difference of 0.030%), Ghanaian (29.4%, a difference of 0.060%), Yugoslavian (29.4%, a difference of 0.10%), and Canadian (29.3%, a difference of 0.12%).
| Demographics | Rating | Rank | Single Mother Poverty |
| Immigrants | Bosnia and Herzegovina | 45.1 /100 | #177 | Average 29.2% |
| South American Indians | 43.2 /100 | #178 | Average 29.3% |
| Immigrants | Uzbekistan | 42.6 /100 | #179 | Average 29.3% |
| Immigrants | Norway | 41.5 /100 | #180 | Average 29.3% |
| Canadians | 40.4 /100 | #181 | Average 29.3% |
| Immigrants | Eastern Africa | 38.5 /100 | #182 | Fair 29.3% |
| Nepalese | 38.3 /100 | #183 | Fair 29.3% |
| Nigerians | 38.0 /100 | #184 | Fair 29.3% |
| Ghanaians | 36.8 /100 | #185 | Fair 29.4% |
| Yugoslavians | 36.0 /100 | #186 | Fair 29.4% |
| Lebanese | 32.5 /100 | #187 | Fair 29.4% |
| Guamanians/Chamorros | 31.8 /100 | #188 | Fair 29.4% |
| Immigrants | Africa | 31.6 /100 | #189 | Fair 29.4% |
| Immigrants | Germany | 30.4 /100 | #190 | Fair 29.5% |
| Immigrants | Trinidad and Tobago | 29.2 /100 | #191 | Fair 29.5% |
Demographics Similar to Tongans by Single Mother Poverty
In terms of single mother poverty, the demographic groups most similar to Tongans are Bulgarian (26.5%, a difference of 0.040%), Immigrants from Indonesia (26.6%, a difference of 0.050%), Maltese (26.6%, a difference of 0.17%), Okinawan (26.6%, a difference of 0.21%), and Immigrants from Israel (26.6%, a difference of 0.22%).
| Demographics | Rating | Rank | Single Mother Poverty |
| Immigrants | Asia | 100.0 /100 | #25 | Exceptional 26.3% |
| Immigrants | Sri Lanka | 100.0 /100 | #26 | Exceptional 26.3% |
| Immigrants | Japan | 100.0 /100 | #27 | Exceptional 26.4% |
| Koreans | 100.0 /100 | #28 | Exceptional 26.4% |
| Jordanians | 100.0 /100 | #29 | Exceptional 26.4% |
| Turks | 100.0 /100 | #30 | Exceptional 26.4% |
| Immigrants | Philippines | 100.0 /100 | #31 | Exceptional 26.5% |
| Tongans | 99.9 /100 | #32 | Exceptional 26.5% |
| Bulgarians | 99.9 /100 | #33 | Exceptional 26.5% |
| Immigrants | Indonesia | 99.9 /100 | #34 | Exceptional 26.6% |
| Maltese | 99.9 /100 | #35 | Exceptional 26.6% |
| Okinawans | 99.9 /100 | #36 | Exceptional 26.6% |
| Immigrants | Israel | 99.9 /100 | #37 | Exceptional 26.6% |
| Immigrants | Fiji | 99.9 /100 | #38 | Exceptional 26.6% |
| Sri Lankans | 99.9 /100 | #39 | Exceptional 26.7% |