Nicaraguan vs Indonesian Single Mother Households
COMPARE
Nicaraguan
Indonesian
Single Mother Households
Single Mother Households Comparison
Nicaraguans
Indonesians
7.2%
SINGLE MOTHER HOUSEHOLDS
0.5/ 100
METRIC RATING
246th/ 347
METRIC RANK
7.5%
SINGLE MOTHER HOUSEHOLDS
0.1/ 100
METRIC RATING
268th/ 347
METRIC RANK
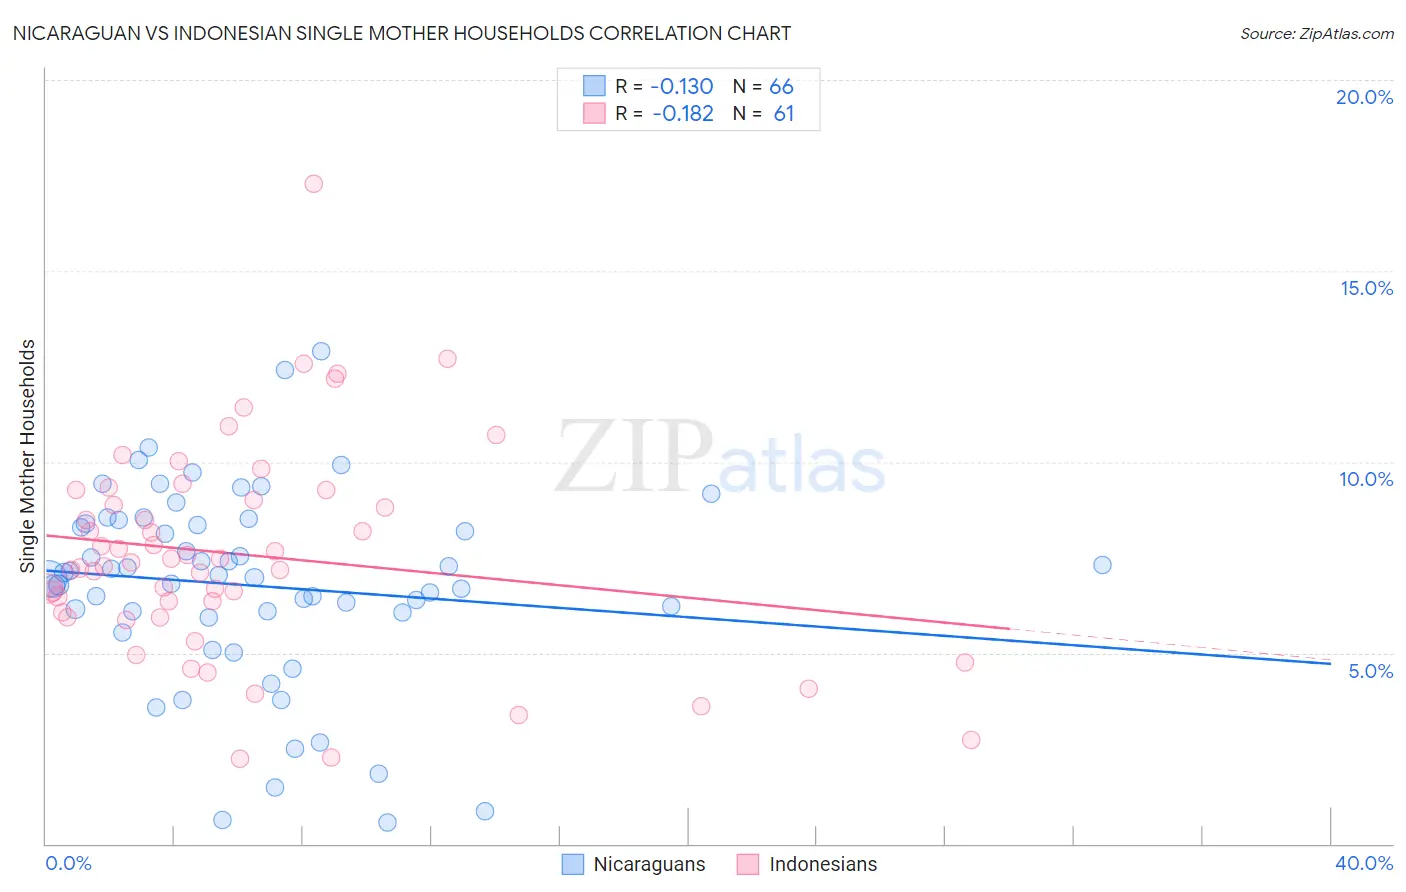
Nicaraguan vs Indonesian Single Mother Households Correlation Chart
The statistical analysis conducted on geographies consisting of 285,416,265 people shows a poor negative correlation between the proportion of Nicaraguans and percentage of single mother households in the United States with a correlation coefficient (R) of -0.130 and weighted average of 7.2%. Similarly, the statistical analysis conducted on geographies consisting of 162,449,880 people shows a poor negative correlation between the proportion of Indonesians and percentage of single mother households in the United States with a correlation coefficient (R) of -0.182 and weighted average of 7.5%, a difference of 3.4%.
Single Mother Households Correlation Summary
| Measurement | Nicaraguan | Indonesian |
| Minimum | 0.56% | 2.2% |
| Maximum | 12.9% | 17.3% |
| Range | 12.4% | 15.0% |
| Mean | 6.8% | 7.6% |
| Median | 7.0% | 7.4% |
| Interquartile 25% (IQ1) | 6.0% | 6.0% |
| Interquartile 75% (IQ3) | 8.4% | 9.1% |
| Interquartile Range (IQR) | 2.3% | 3.1% |
| Standard Deviation (Sample) | 2.6% | 2.8% |
| Standard Deviation (Population) | 2.5% | 2.7% |
Similar Demographics by Single Mother Households
Demographics Similar to Nicaraguans by Single Mother Households
In terms of single mother households, the demographic groups most similar to Nicaraguans are Immigrants from Cambodia (7.2%, a difference of 0.18%), Dutch West Indian (7.3%, a difference of 0.25%), Spanish American Indian (7.3%, a difference of 0.28%), Cuban (7.2%, a difference of 0.53%), and Bermudan (7.3%, a difference of 0.57%).
| Demographics | Rating | Rank | Single Mother Households |
| Kiowa | 0.8 /100 | #239 | Tragic 7.1% |
| Immigrants | Panama | 0.7 /100 | #240 | Tragic 7.2% |
| Immigrants | Portugal | 0.6 /100 | #241 | Tragic 7.2% |
| Fijians | 0.6 /100 | #242 | Tragic 7.2% |
| Ecuadorians | 0.6 /100 | #243 | Tragic 7.2% |
| Cubans | 0.6 /100 | #244 | Tragic 7.2% |
| Immigrants | Cambodia | 0.5 /100 | #245 | Tragic 7.2% |
| Nicaraguans | 0.5 /100 | #246 | Tragic 7.2% |
| Dutch West Indians | 0.4 /100 | #247 | Tragic 7.3% |
| Spanish American Indians | 0.4 /100 | #248 | Tragic 7.3% |
| Bermudans | 0.4 /100 | #249 | Tragic 7.3% |
| Immigrants | Africa | 0.4 /100 | #250 | Tragic 7.3% |
| Malaysians | 0.3 /100 | #251 | Tragic 7.3% |
| Alaskan Athabascans | 0.3 /100 | #252 | Tragic 7.3% |
| Cajuns | 0.3 /100 | #253 | Tragic 7.3% |
Demographics Similar to Indonesians by Single Mother Households
In terms of single mother households, the demographic groups most similar to Indonesians are Blackfeet (7.5%, a difference of 0.040%), Nepalese (7.5%, a difference of 0.38%), Somali (7.5%, a difference of 0.41%), Crow (7.4%, a difference of 0.48%), and Immigrants from Cuba (7.5%, a difference of 0.58%).
| Demographics | Rating | Rank | Single Mother Households |
| Japanese | 0.2 /100 | #261 | Tragic 7.4% |
| Immigrants | Somalia | 0.2 /100 | #262 | Tragic 7.4% |
| Immigrants | Nicaragua | 0.2 /100 | #263 | Tragic 7.4% |
| Yaqui | 0.1 /100 | #264 | Tragic 7.4% |
| Crow | 0.1 /100 | #265 | Tragic 7.4% |
| Nepalese | 0.1 /100 | #266 | Tragic 7.5% |
| Blackfeet | 0.1 /100 | #267 | Tragic 7.5% |
| Indonesians | 0.1 /100 | #268 | Tragic 7.5% |
| Somalis | 0.1 /100 | #269 | Tragic 7.5% |
| Immigrants | Cuba | 0.1 /100 | #270 | Tragic 7.5% |
| Salvadorans | 0.1 /100 | #271 | Tragic 7.5% |
| Immigrants | Azores | 0.1 /100 | #272 | Tragic 7.5% |
| Belizeans | 0.1 /100 | #273 | Tragic 7.6% |
| Immigrants | Guyana | 0.1 /100 | #274 | Tragic 7.6% |
| Central American Indians | 0.1 /100 | #275 | Tragic 7.6% |