Nicaraguan vs Immigrants from Kazakhstan 2nd Grade
COMPARE
Nicaraguan
Immigrants from Kazakhstan
2nd Grade
2nd Grade Comparison
Nicaraguans
Immigrants from Kazakhstan
96.9%
2ND GRADE
0.0/ 100
METRIC RATING
305th/ 347
METRIC RANK
97.8%
2ND GRADE
35.6/ 100
METRIC RATING
188th/ 347
METRIC RANK
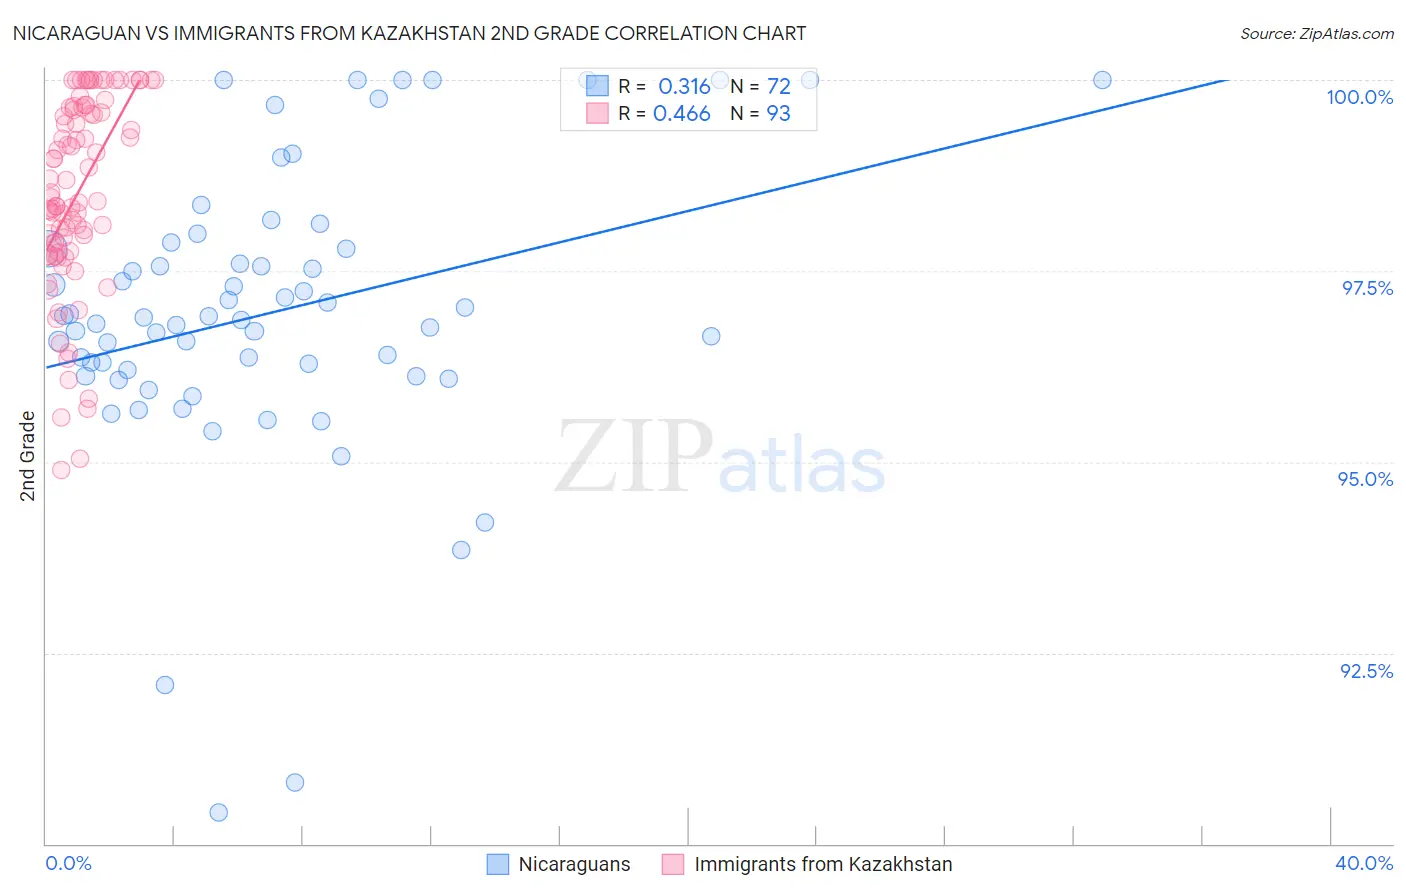
Nicaraguan vs Immigrants from Kazakhstan 2nd Grade Correlation Chart
The statistical analysis conducted on geographies consisting of 285,711,389 people shows a mild positive correlation between the proportion of Nicaraguans and percentage of population with at least 2nd grade education in the United States with a correlation coefficient (R) of 0.316 and weighted average of 96.9%. Similarly, the statistical analysis conducted on geographies consisting of 124,444,388 people shows a moderate positive correlation between the proportion of Immigrants from Kazakhstan and percentage of population with at least 2nd grade education in the United States with a correlation coefficient (R) of 0.466 and weighted average of 97.8%, a difference of 0.96%.
2nd Grade Correlation Summary
| Measurement | Nicaraguan | Immigrants from Kazakhstan |
| Minimum | 90.4% | 94.9% |
| Maximum | 100.0% | 100.0% |
| Range | 9.6% | 5.1% |
| Mean | 97.0% | 98.5% |
| Median | 96.9% | 98.5% |
| Interquartile 25% (IQ1) | 96.2% | 97.8% |
| Interquartile 75% (IQ3) | 97.8% | 99.6% |
| Interquartile Range (IQR) | 1.6% | 1.9% |
| Standard Deviation (Sample) | 1.9% | 1.3% |
| Standard Deviation (Population) | 1.9% | 1.3% |
Similar Demographics by 2nd Grade
Demographics Similar to Nicaraguans by 2nd Grade
In terms of 2nd grade, the demographic groups most similar to Nicaraguans are Ecuadorian (96.9%, a difference of 0.020%), Immigrants from Caribbean (96.9%, a difference of 0.020%), Immigrants from Somalia (96.9%, a difference of 0.020%), Immigrants from the Azores (96.8%, a difference of 0.050%), and Immigrants from Haiti (96.8%, a difference of 0.050%).
| Demographics | Rating | Rank | 2nd Grade |
| Immigrants | Dominica | 0.0 /100 | #298 | Tragic 97.0% |
| Haitians | 0.0 /100 | #299 | Tragic 97.0% |
| Immigrants | South Eastern Asia | 0.0 /100 | #300 | Tragic 97.0% |
| Central American Indians | 0.0 /100 | #301 | Tragic 97.0% |
| Somalis | 0.0 /100 | #302 | Tragic 97.0% |
| Ecuadorians | 0.0 /100 | #303 | Tragic 96.9% |
| Immigrants | Caribbean | 0.0 /100 | #304 | Tragic 96.9% |
| Nicaraguans | 0.0 /100 | #305 | Tragic 96.9% |
| Immigrants | Somalia | 0.0 /100 | #306 | Tragic 96.9% |
| Immigrants | Azores | 0.0 /100 | #307 | Tragic 96.8% |
| Immigrants | Haiti | 0.0 /100 | #308 | Tragic 96.8% |
| Belizeans | 0.0 /100 | #309 | Tragic 96.8% |
| Sri Lankans | 0.0 /100 | #310 | Tragic 96.8% |
| Guyanese | 0.0 /100 | #311 | Tragic 96.8% |
| Cape Verdeans | 0.0 /100 | #312 | Tragic 96.8% |
Demographics Similar to Immigrants from Kazakhstan by 2nd Grade
In terms of 2nd grade, the demographic groups most similar to Immigrants from Kazakhstan are Arab (97.8%, a difference of 0.0%), Pakistani (97.8%, a difference of 0.0%), Panamanian (97.8%, a difference of 0.010%), Immigrants from Taiwan (97.8%, a difference of 0.010%), and Portuguese (97.8%, a difference of 0.020%).
| Demographics | Rating | Rank | 2nd Grade |
| Egyptians | 44.3 /100 | #181 | Average 97.9% |
| Portuguese | 42.4 /100 | #182 | Average 97.8% |
| Immigrants | Poland | 42.2 /100 | #183 | Average 97.8% |
| Immigrants | Belarus | 41.5 /100 | #184 | Average 97.8% |
| Immigrants | Argentina | 40.6 /100 | #185 | Average 97.8% |
| Arabs | 36.9 /100 | #186 | Fair 97.8% |
| Pakistanis | 36.1 /100 | #187 | Fair 97.8% |
| Immigrants | Kazakhstan | 35.6 /100 | #188 | Fair 97.8% |
| Panamanians | 33.5 /100 | #189 | Fair 97.8% |
| Immigrants | Taiwan | 31.8 /100 | #190 | Fair 97.8% |
| Paraguayans | 30.8 /100 | #191 | Fair 97.8% |
| Blacks/African Americans | 29.9 /100 | #192 | Fair 97.8% |
| Hawaiians | 28.5 /100 | #193 | Fair 97.8% |
| Paiute | 27.0 /100 | #194 | Fair 97.8% |
| Mongolians | 26.7 /100 | #195 | Fair 97.8% |