New Zealander vs Cree Poverty
COMPARE
New Zealander
Cree
Poverty
Poverty Comparison
New Zealanders
Cree
11.7%
POVERTY
88.7/ 100
METRIC RATING
121st/ 347
METRIC RANK
14.2%
POVERTY
0.2/ 100
METRIC RATING
250th/ 347
METRIC RANK
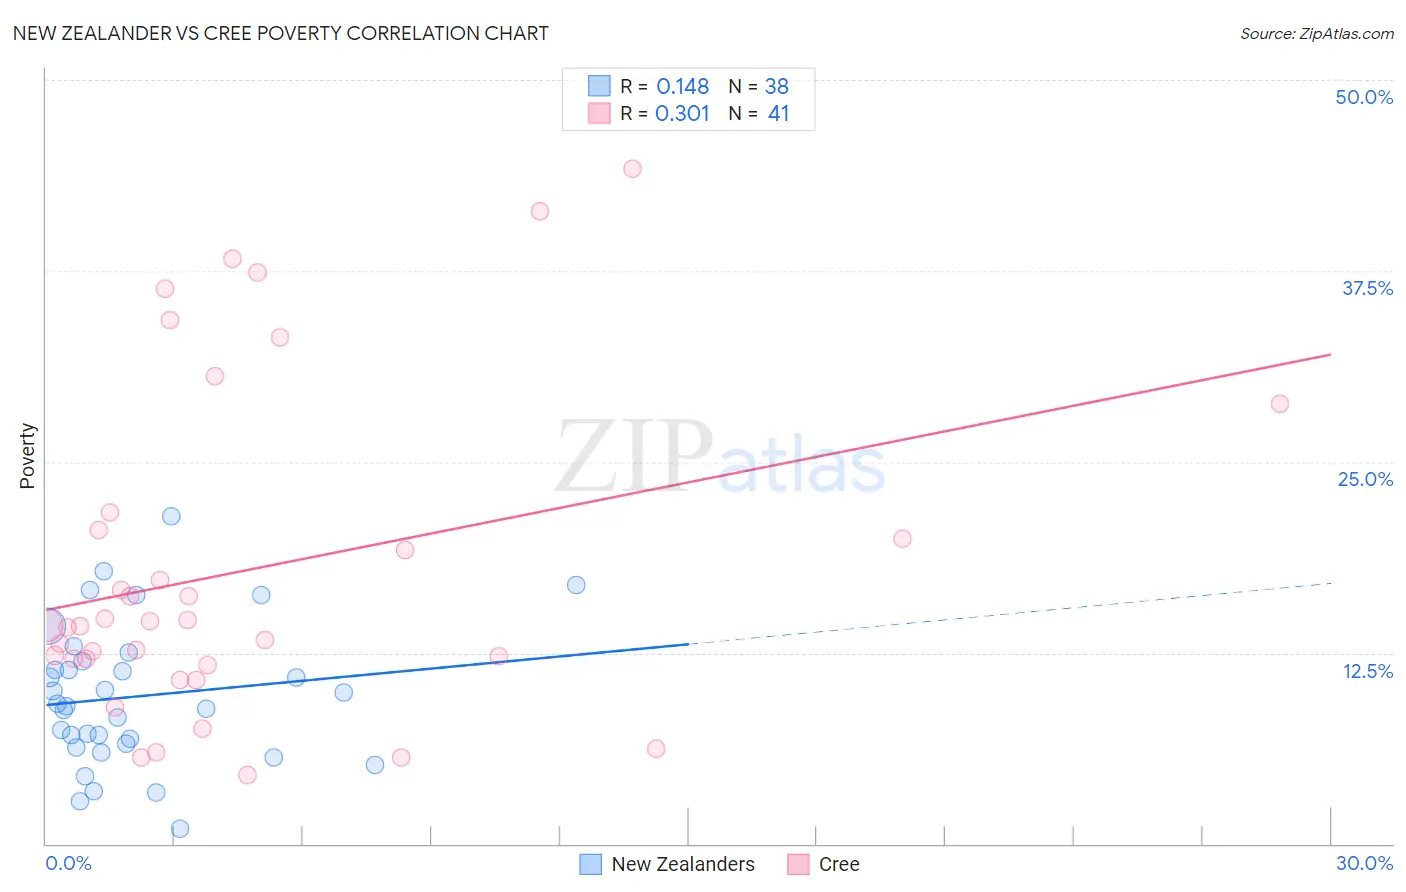
New Zealander vs Cree Poverty Correlation Chart
The statistical analysis conducted on geographies consisting of 106,895,719 people shows a poor positive correlation between the proportion of New Zealanders and poverty level in the United States with a correlation coefficient (R) of 0.148 and weighted average of 11.7%. Similarly, the statistical analysis conducted on geographies consisting of 76,209,034 people shows a mild positive correlation between the proportion of Cree and poverty level in the United States with a correlation coefficient (R) of 0.301 and weighted average of 14.2%, a difference of 21.3%.
Poverty Correlation Summary
| Measurement | New Zealander | Cree |
| Minimum | 0.99% | 4.5% |
| Maximum | 21.4% | 44.2% |
| Range | 20.4% | 39.7% |
| Mean | 9.7% | 18.0% |
| Median | 9.1% | 14.3% |
| Interquartile 25% (IQ1) | 6.6% | 11.9% |
| Interquartile 75% (IQ3) | 12.0% | 21.1% |
| Interquartile Range (IQR) | 5.4% | 9.2% |
| Standard Deviation (Sample) | 4.6% | 10.7% |
| Standard Deviation (Population) | 4.6% | 10.6% |
Similar Demographics by Poverty
Demographics Similar to New Zealanders by Poverty
In terms of poverty, the demographic groups most similar to New Zealanders are Puget Sound Salish (11.7%, a difference of 0.0%), Immigrants from Hungary (11.7%, a difference of 0.020%), Immigrants from South Eastern Asia (11.7%, a difference of 0.060%), Tlingit-Haida (11.7%, a difference of 0.070%), and Soviet Union (11.7%, a difference of 0.090%).
| Demographics | Rating | Rank | Poverty |
| Immigrants | China | 90.7 /100 | #114 | Exceptional 11.6% |
| Albanians | 90.3 /100 | #115 | Exceptional 11.7% |
| Immigrants | Russia | 89.7 /100 | #116 | Excellent 11.7% |
| Sri Lankans | 89.4 /100 | #117 | Excellent 11.7% |
| Argentineans | 89.1 /100 | #118 | Excellent 11.7% |
| Tlingit-Haida | 89.0 /100 | #119 | Excellent 11.7% |
| Immigrants | South Eastern Asia | 88.9 /100 | #120 | Excellent 11.7% |
| New Zealanders | 88.7 /100 | #121 | Excellent 11.7% |
| Puget Sound Salish | 88.7 /100 | #122 | Excellent 11.7% |
| Immigrants | Hungary | 88.6 /100 | #123 | Excellent 11.7% |
| Soviet Union | 88.4 /100 | #124 | Excellent 11.7% |
| Immigrants | Brazil | 88.2 /100 | #125 | Excellent 11.7% |
| Immigrants | Norway | 88.0 /100 | #126 | Excellent 11.7% |
| Immigrants | Argentina | 88.0 /100 | #127 | Excellent 11.7% |
| Immigrants | Israel | 87.4 /100 | #128 | Excellent 11.7% |
Demographics Similar to Cree by Poverty
In terms of poverty, the demographic groups most similar to Cree are Immigrants from Burma/Myanmar (14.2%, a difference of 0.090%), Spanish American Indian (14.2%, a difference of 0.20%), Immigrants from Ghana (14.2%, a difference of 0.30%), Immigrants from Trinidad and Tobago (14.2%, a difference of 0.31%), and Immigrants from Western Africa (14.1%, a difference of 0.39%).
| Demographics | Rating | Rank | Poverty |
| Sudanese | 0.3 /100 | #243 | Tragic 14.0% |
| Nepalese | 0.3 /100 | #244 | Tragic 14.0% |
| Immigrants | Sudan | 0.3 /100 | #245 | Tragic 14.1% |
| Potawatomi | 0.3 /100 | #246 | Tragic 14.1% |
| Liberians | 0.2 /100 | #247 | Tragic 14.1% |
| Immigrants | Western Africa | 0.2 /100 | #248 | Tragic 14.1% |
| Immigrants | Ghana | 0.2 /100 | #249 | Tragic 14.2% |
| Cree | 0.2 /100 | #250 | Tragic 14.2% |
| Immigrants | Burma/Myanmar | 0.2 /100 | #251 | Tragic 14.2% |
| Spanish American Indians | 0.2 /100 | #252 | Tragic 14.2% |
| Immigrants | Trinidad and Tobago | 0.2 /100 | #253 | Tragic 14.2% |
| Immigrants | El Salvador | 0.1 /100 | #254 | Tragic 14.3% |
| Immigrants | Ecuador | 0.1 /100 | #255 | Tragic 14.3% |
| Mexican American Indians | 0.1 /100 | #256 | Tragic 14.3% |
| Trinidadians and Tobagonians | 0.1 /100 | #257 | Tragic 14.3% |