Latvian vs Immigrants from St. Vincent and the Grenadines Poverty
COMPARE
Latvian
Immigrants from St. Vincent and the Grenadines
Poverty
Poverty Comparison
Latvians
Immigrants from St. Vincent and the Grenadines
10.5%
POVERTY
99.8/ 100
METRIC RATING
18th/ 347
METRIC RANK
14.9%
POVERTY
0.0/ 100
METRIC RATING
279th/ 347
METRIC RANK
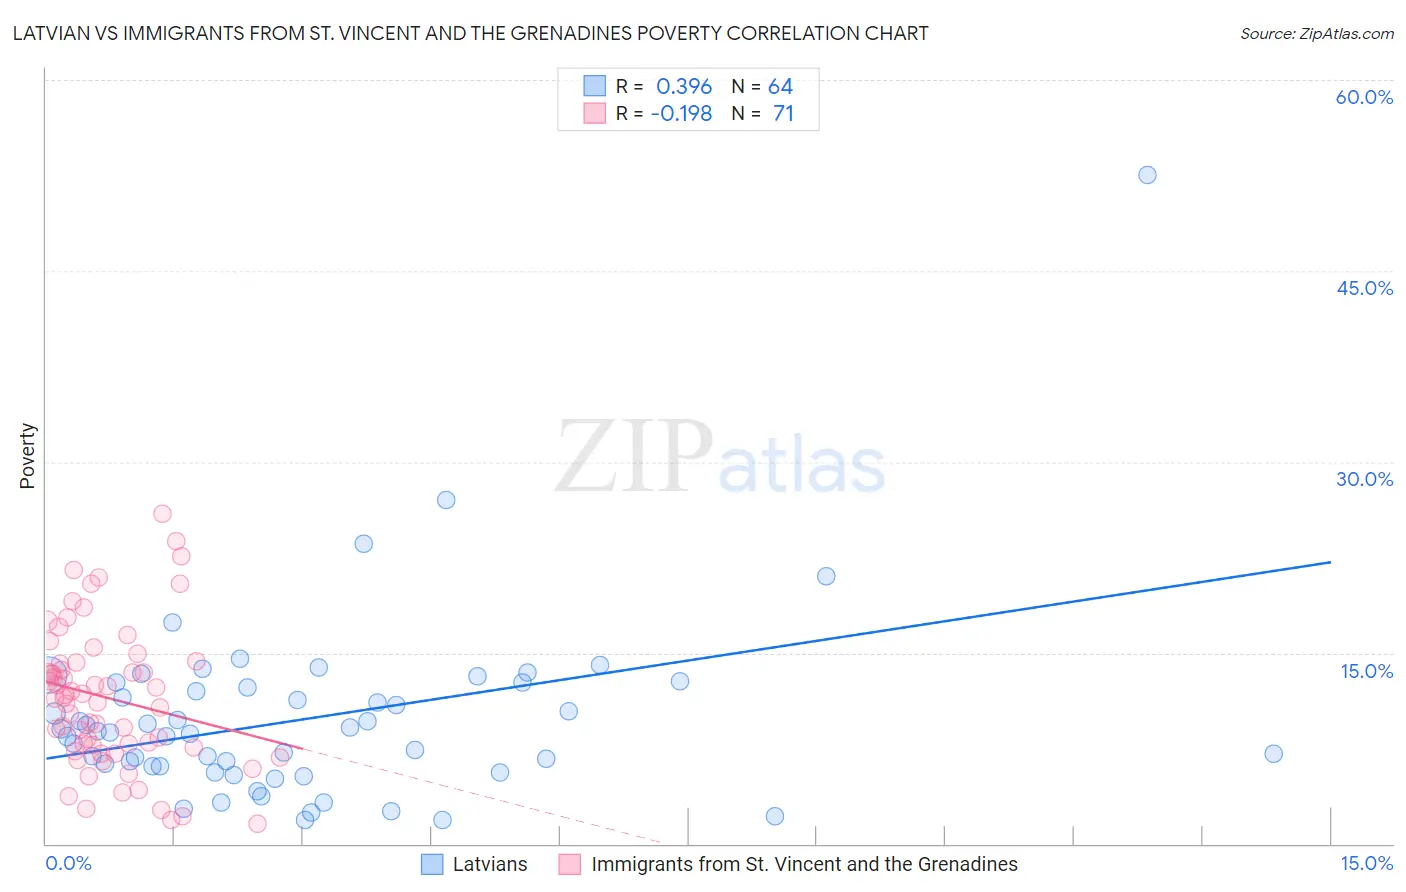
Latvian vs Immigrants from St. Vincent and the Grenadines Poverty Correlation Chart
The statistical analysis conducted on geographies consisting of 220,650,145 people shows a mild positive correlation between the proportion of Latvians and poverty level in the United States with a correlation coefficient (R) of 0.396 and weighted average of 10.5%. Similarly, the statistical analysis conducted on geographies consisting of 56,091,353 people shows a poor negative correlation between the proportion of Immigrants from St. Vincent and the Grenadines and poverty level in the United States with a correlation coefficient (R) of -0.198 and weighted average of 14.9%, a difference of 41.3%.
Poverty Correlation Summary
| Measurement | Latvian | Immigrants from St. Vincent and the Grenadines |
| Minimum | 1.8% | 1.6% |
| Maximum | 52.6% | 25.9% |
| Range | 50.7% | 24.3% |
| Mean | 9.9% | 11.5% |
| Median | 8.8% | 11.5% |
| Interquartile 25% (IQ1) | 6.1% | 7.5% |
| Interquartile 75% (IQ3) | 12.5% | 14.2% |
| Interquartile Range (IQR) | 6.4% | 6.7% |
| Standard Deviation (Sample) | 7.3% | 5.5% |
| Standard Deviation (Population) | 7.3% | 5.5% |
Similar Demographics by Poverty
Demographics Similar to Latvians by Poverty
In terms of poverty, the demographic groups most similar to Latvians are Norwegian (10.5%, a difference of 0.10%), Immigrants from Scotland (10.6%, a difference of 0.39%), Lithuanian (10.5%, a difference of 0.46%), Immigrants from North Macedonia (10.6%, a difference of 0.51%), and Luxembourger (10.6%, a difference of 0.58%).
| Demographics | Rating | Rank | Poverty |
| Immigrants | Lithuania | 99.9 /100 | #11 | Exceptional 10.3% |
| Bhutanese | 99.8 /100 | #12 | Exceptional 10.4% |
| Immigrants | Hong Kong | 99.8 /100 | #13 | Exceptional 10.4% |
| Immigrants | Bolivia | 99.8 /100 | #14 | Exceptional 10.4% |
| Bolivians | 99.8 /100 | #15 | Exceptional 10.4% |
| Lithuanians | 99.8 /100 | #16 | Exceptional 10.5% |
| Norwegians | 99.8 /100 | #17 | Exceptional 10.5% |
| Latvians | 99.8 /100 | #18 | Exceptional 10.5% |
| Immigrants | Scotland | 99.7 /100 | #19 | Exceptional 10.6% |
| Immigrants | North Macedonia | 99.7 /100 | #20 | Exceptional 10.6% |
| Luxembourgers | 99.7 /100 | #21 | Exceptional 10.6% |
| Eastern Europeans | 99.7 /100 | #22 | Exceptional 10.6% |
| Swedes | 99.7 /100 | #23 | Exceptional 10.6% |
| Italians | 99.7 /100 | #24 | Exceptional 10.6% |
| Croatians | 99.6 /100 | #25 | Exceptional 10.6% |
Demographics Similar to Immigrants from St. Vincent and the Grenadines by Poverty
In terms of poverty, the demographic groups most similar to Immigrants from St. Vincent and the Grenadines are Haitian (14.9%, a difference of 0.20%), Immigrants from Barbados (14.9%, a difference of 0.27%), Belizean (14.8%, a difference of 0.29%), Bangladeshi (14.8%, a difference of 0.31%), and Immigrants from West Indies (14.8%, a difference of 0.37%).
| Demographics | Rating | Rank | Poverty |
| Chickasaw | 0.0 /100 | #272 | Tragic 14.7% |
| Spanish Americans | 0.0 /100 | #273 | Tragic 14.7% |
| Barbadians | 0.0 /100 | #274 | Tragic 14.8% |
| Immigrants | West Indies | 0.0 /100 | #275 | Tragic 14.8% |
| Immigrants | Bahamas | 0.0 /100 | #276 | Tragic 14.8% |
| Bangladeshis | 0.0 /100 | #277 | Tragic 14.8% |
| Belizeans | 0.0 /100 | #278 | Tragic 14.8% |
| Immigrants | St. Vincent and the Grenadines | 0.0 /100 | #279 | Tragic 14.9% |
| Haitians | 0.0 /100 | #280 | Tragic 14.9% |
| Immigrants | Barbados | 0.0 /100 | #281 | Tragic 14.9% |
| Comanche | 0.0 /100 | #282 | Tragic 15.0% |
| Immigrants | Haiti | 0.0 /100 | #283 | Tragic 15.0% |
| West Indians | 0.0 /100 | #284 | Tragic 15.0% |
| Vietnamese | 0.0 /100 | #285 | Tragic 15.0% |
| Immigrants | Latin America | 0.0 /100 | #286 | Tragic 15.0% |