Kiowa vs Immigrants from Panama Child Poverty Under the Age of 16
COMPARE
Kiowa
Immigrants from Panama
Child Poverty Under the Age of 16
Child Poverty Under the Age of 16 Comparison
Kiowa
Immigrants from Panama
22.2%
CHILD POVERTY UNDER THE AGE OF 16
0.0/ 100
METRIC RATING
321st/ 347
METRIC RANK
17.7%
CHILD POVERTY UNDER THE AGE OF 16
4.1/ 100
METRIC RATING
220th/ 347
METRIC RANK
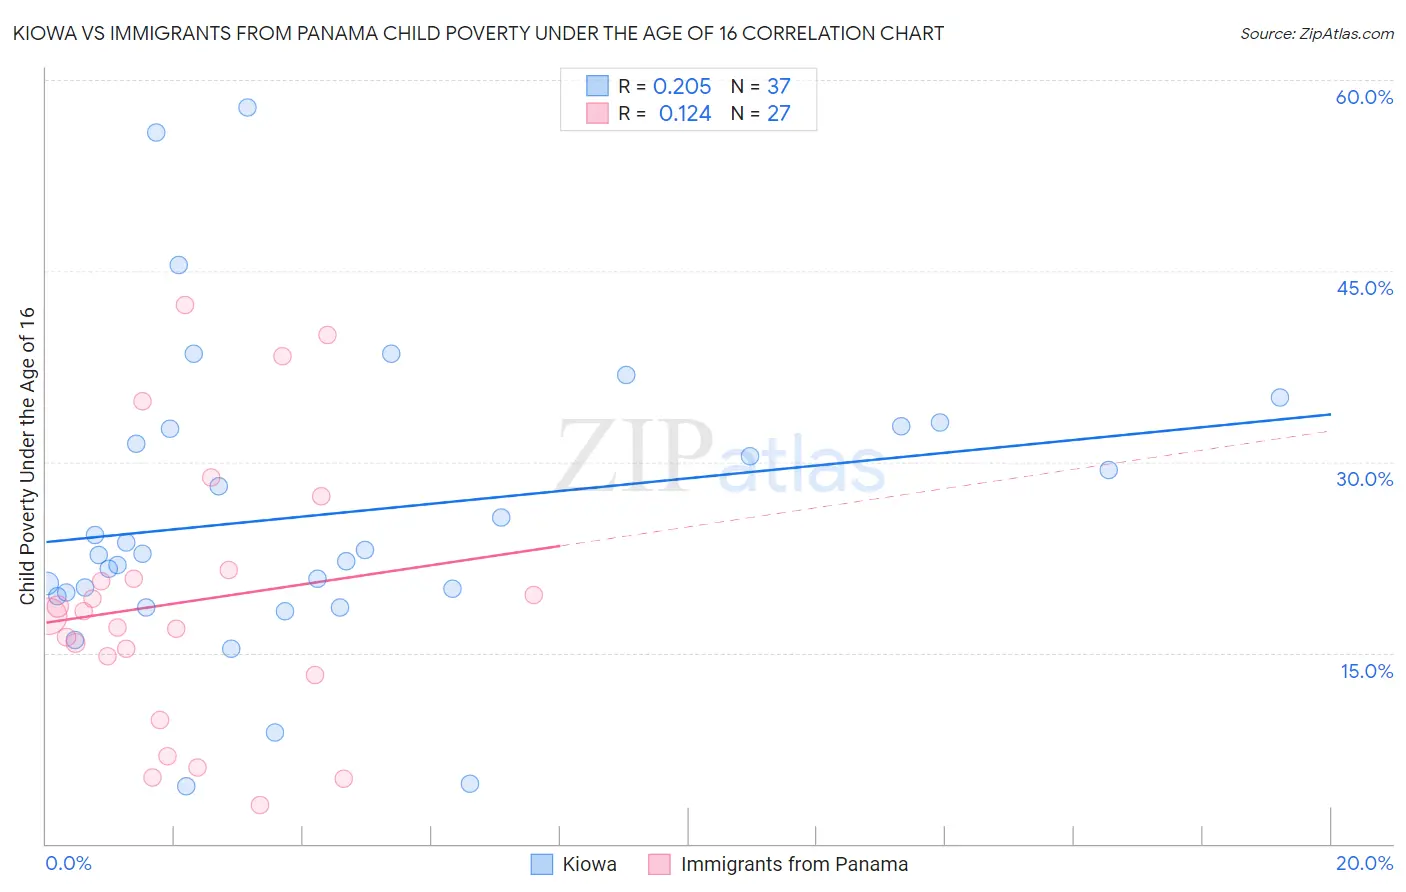
Kiowa vs Immigrants from Panama Child Poverty Under the Age of 16 Correlation Chart
The statistical analysis conducted on geographies consisting of 56,050,498 people shows a weak positive correlation between the proportion of Kiowa and poverty level among children under the age of 16 in the United States with a correlation coefficient (R) of 0.205 and weighted average of 22.2%. Similarly, the statistical analysis conducted on geographies consisting of 220,562,489 people shows a poor positive correlation between the proportion of Immigrants from Panama and poverty level among children under the age of 16 in the United States with a correlation coefficient (R) of 0.124 and weighted average of 17.7%, a difference of 24.9%.
Child Poverty Under the Age of 16 Correlation Summary
| Measurement | Kiowa | Immigrants from Panama |
| Minimum | 4.5% | 3.1% |
| Maximum | 57.9% | 42.3% |
| Range | 53.4% | 39.2% |
| Mean | 25.9% | 19.0% |
| Median | 22.8% | 17.9% |
| Interquartile 25% (IQ1) | 19.6% | 13.3% |
| Interquartile 75% (IQ3) | 32.7% | 21.5% |
| Interquartile Range (IQR) | 13.1% | 8.2% |
| Standard Deviation (Sample) | 11.7% | 10.6% |
| Standard Deviation (Population) | 11.5% | 10.4% |
Similar Demographics by Child Poverty Under the Age of 16
Demographics Similar to Kiowa by Child Poverty Under the Age of 16
In terms of child poverty under the age of 16, the demographic groups most similar to Kiowa are Cajun (22.1%, a difference of 0.19%), Honduran (22.2%, a difference of 0.19%), Yakama (22.1%, a difference of 0.39%), U.S. Virgin Islander (22.0%, a difference of 0.90%), and Paiute (22.4%, a difference of 1.2%).
| Demographics | Rating | Rank | Child Poverty Under the Age of 16 |
| Immigrants | Somalia | 0.0 /100 | #314 | Tragic 21.6% |
| Immigrants | Guatemala | 0.0 /100 | #315 | Tragic 21.6% |
| Africans | 0.0 /100 | #316 | Tragic 21.7% |
| Immigrants | Dominica | 0.0 /100 | #317 | Tragic 21.9% |
| U.S. Virgin Islanders | 0.0 /100 | #318 | Tragic 22.0% |
| Yakama | 0.0 /100 | #319 | Tragic 22.1% |
| Cajuns | 0.0 /100 | #320 | Tragic 22.1% |
| Kiowa | 0.0 /100 | #321 | Tragic 22.2% |
| Hondurans | 0.0 /100 | #322 | Tragic 22.2% |
| Paiute | 0.0 /100 | #323 | Tragic 22.4% |
| Central American Indians | 0.0 /100 | #324 | Tragic 22.5% |
| Immigrants | Congo | 0.0 /100 | #325 | Tragic 22.5% |
| Immigrants | Honduras | 0.0 /100 | #326 | Tragic 22.7% |
| Menominee | 0.0 /100 | #327 | Tragic 23.0% |
| Colville | 0.0 /100 | #328 | Tragic 23.0% |
Demographics Similar to Immigrants from Panama by Child Poverty Under the Age of 16
In terms of child poverty under the age of 16, the demographic groups most similar to Immigrants from Panama are Cuban (17.8%, a difference of 0.27%), Immigrants from Armenia (17.8%, a difference of 0.33%), Japanese (17.7%, a difference of 0.40%), Immigrants from Cambodia (17.8%, a difference of 0.57%), and Moroccan (17.6%, a difference of 0.77%).
| Demographics | Rating | Rank | Child Poverty Under the Age of 16 |
| Immigrants | Azores | 6.2 /100 | #213 | Tragic 17.5% |
| Iraqis | 5.9 /100 | #214 | Tragic 17.5% |
| Malaysians | 5.9 /100 | #215 | Tragic 17.5% |
| Sierra Leoneans | 5.7 /100 | #216 | Tragic 17.6% |
| Immigrants | Eastern Africa | 5.3 /100 | #217 | Tragic 17.6% |
| Moroccans | 5.3 /100 | #218 | Tragic 17.6% |
| Japanese | 4.7 /100 | #219 | Tragic 17.7% |
| Immigrants | Panama | 4.1 /100 | #220 | Tragic 17.7% |
| Cubans | 3.7 /100 | #221 | Tragic 17.8% |
| Immigrants | Armenia | 3.6 /100 | #222 | Tragic 17.8% |
| Immigrants | Cambodia | 3.3 /100 | #223 | Tragic 17.8% |
| Osage | 3.1 /100 | #224 | Tragic 17.9% |
| Immigrants | Nonimmigrants | 2.7 /100 | #225 | Tragic 17.9% |
| Bermudans | 2.6 /100 | #226 | Tragic 18.0% |
| Immigrants | Africa | 2.5 /100 | #227 | Tragic 18.0% |