Colombian vs Immigrants from Panama Child Poverty Under the Age of 16
COMPARE
Colombian
Immigrants from Panama
Child Poverty Under the Age of 16
Child Poverty Under the Age of 16 Comparison
Colombians
Immigrants from Panama
15.8%
CHILD POVERTY UNDER THE AGE OF 16
67.6/ 100
METRIC RATING
162nd/ 347
METRIC RANK
17.7%
CHILD POVERTY UNDER THE AGE OF 16
4.1/ 100
METRIC RATING
220th/ 347
METRIC RANK
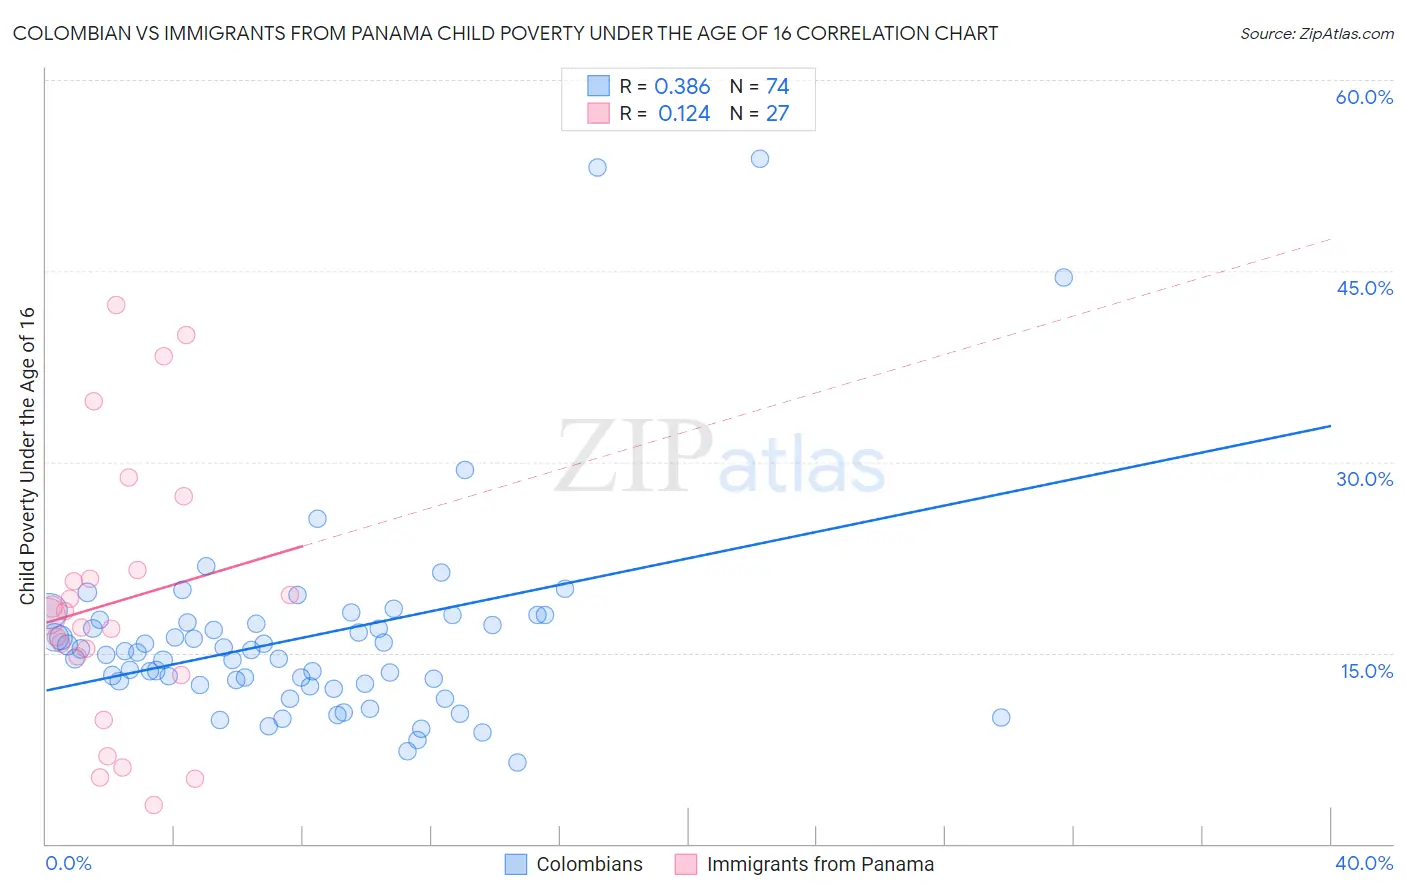
Colombian vs Immigrants from Panama Child Poverty Under the Age of 16 Correlation Chart
The statistical analysis conducted on geographies consisting of 415,703,397 people shows a mild positive correlation between the proportion of Colombians and poverty level among children under the age of 16 in the United States with a correlation coefficient (R) of 0.386 and weighted average of 15.8%. Similarly, the statistical analysis conducted on geographies consisting of 220,562,489 people shows a poor positive correlation between the proportion of Immigrants from Panama and poverty level among children under the age of 16 in the United States with a correlation coefficient (R) of 0.124 and weighted average of 17.7%, a difference of 11.9%.
Child Poverty Under the Age of 16 Correlation Summary
| Measurement | Colombian | Immigrants from Panama |
| Minimum | 6.4% | 3.1% |
| Maximum | 53.8% | 42.3% |
| Range | 47.4% | 39.2% |
| Mean | 16.2% | 19.0% |
| Median | 15.1% | 17.9% |
| Interquartile 25% (IQ1) | 12.6% | 13.3% |
| Interquartile 75% (IQ3) | 17.4% | 21.5% |
| Interquartile Range (IQR) | 4.8% | 8.2% |
| Standard Deviation (Sample) | 8.2% | 10.6% |
| Standard Deviation (Population) | 8.1% | 10.4% |
Similar Demographics by Child Poverty Under the Age of 16
Demographics Similar to Colombians by Child Poverty Under the Age of 16
In terms of child poverty under the age of 16, the demographic groups most similar to Colombians are Yugoslavian (15.8%, a difference of 0.0%), Immigrants from Germany (15.8%, a difference of 0.040%), Immigrants from Northern Africa (15.8%, a difference of 0.060%), Guamanian/Chamorro (15.9%, a difference of 0.17%), and Immigrants from Oceania (15.9%, a difference of 0.30%).
| Demographics | Rating | Rank | Child Poverty Under the Age of 16 |
| Syrians | 76.1 /100 | #155 | Good 15.6% |
| Immigrants | Venezuela | 74.9 /100 | #156 | Good 15.7% |
| Immigrants | Nepal | 72.9 /100 | #157 | Good 15.7% |
| Immigrants | Chile | 72.8 /100 | #158 | Good 15.7% |
| Immigrants | Fiji | 71.1 /100 | #159 | Good 15.8% |
| Immigrants | Albania | 70.7 /100 | #160 | Good 15.8% |
| Immigrants | Northern Africa | 68.1 /100 | #161 | Good 15.8% |
| Colombians | 67.6 /100 | #162 | Good 15.8% |
| Yugoslavians | 67.6 /100 | #163 | Good 15.8% |
| Immigrants | Germany | 67.3 /100 | #164 | Good 15.8% |
| Guamanians/Chamorros | 66.4 /100 | #165 | Good 15.9% |
| Immigrants | Oceania | 65.4 /100 | #166 | Good 15.9% |
| Costa Ricans | 61.1 /100 | #167 | Good 16.0% |
| South Americans | 57.9 /100 | #168 | Average 16.0% |
| Uruguayans | 54.7 /100 | #169 | Average 16.1% |
Demographics Similar to Immigrants from Panama by Child Poverty Under the Age of 16
In terms of child poverty under the age of 16, the demographic groups most similar to Immigrants from Panama are Cuban (17.8%, a difference of 0.27%), Immigrants from Armenia (17.8%, a difference of 0.33%), Japanese (17.7%, a difference of 0.40%), Immigrants from Cambodia (17.8%, a difference of 0.57%), and Moroccan (17.6%, a difference of 0.77%).
| Demographics | Rating | Rank | Child Poverty Under the Age of 16 |
| Immigrants | Azores | 6.2 /100 | #213 | Tragic 17.5% |
| Iraqis | 5.9 /100 | #214 | Tragic 17.5% |
| Malaysians | 5.9 /100 | #215 | Tragic 17.5% |
| Sierra Leoneans | 5.7 /100 | #216 | Tragic 17.6% |
| Immigrants | Eastern Africa | 5.3 /100 | #217 | Tragic 17.6% |
| Moroccans | 5.3 /100 | #218 | Tragic 17.6% |
| Japanese | 4.7 /100 | #219 | Tragic 17.7% |
| Immigrants | Panama | 4.1 /100 | #220 | Tragic 17.7% |
| Cubans | 3.7 /100 | #221 | Tragic 17.8% |
| Immigrants | Armenia | 3.6 /100 | #222 | Tragic 17.8% |
| Immigrants | Cambodia | 3.3 /100 | #223 | Tragic 17.8% |
| Osage | 3.1 /100 | #224 | Tragic 17.9% |
| Immigrants | Nonimmigrants | 2.7 /100 | #225 | Tragic 17.9% |
| Bermudans | 2.6 /100 | #226 | Tragic 18.0% |
| Immigrants | Africa | 2.5 /100 | #227 | Tragic 18.0% |