Nepalese vs Immigrants from Portugal Child Poverty Among Boys Under 16
COMPARE
Nepalese
Immigrants from Portugal
Child Poverty Among Boys Under 16
Child Poverty Among Boys Under 16 Comparison
Nepalese
Immigrants from Portugal
18.0%
CHILD POVERTY AMONG BOYS UNDER 16
3.2/ 100
METRIC RATING
224th/ 347
METRIC RANK
17.4%
CHILD POVERTY AMONG BOYS UNDER 16
11.2/ 100
METRIC RATING
205th/ 347
METRIC RANK
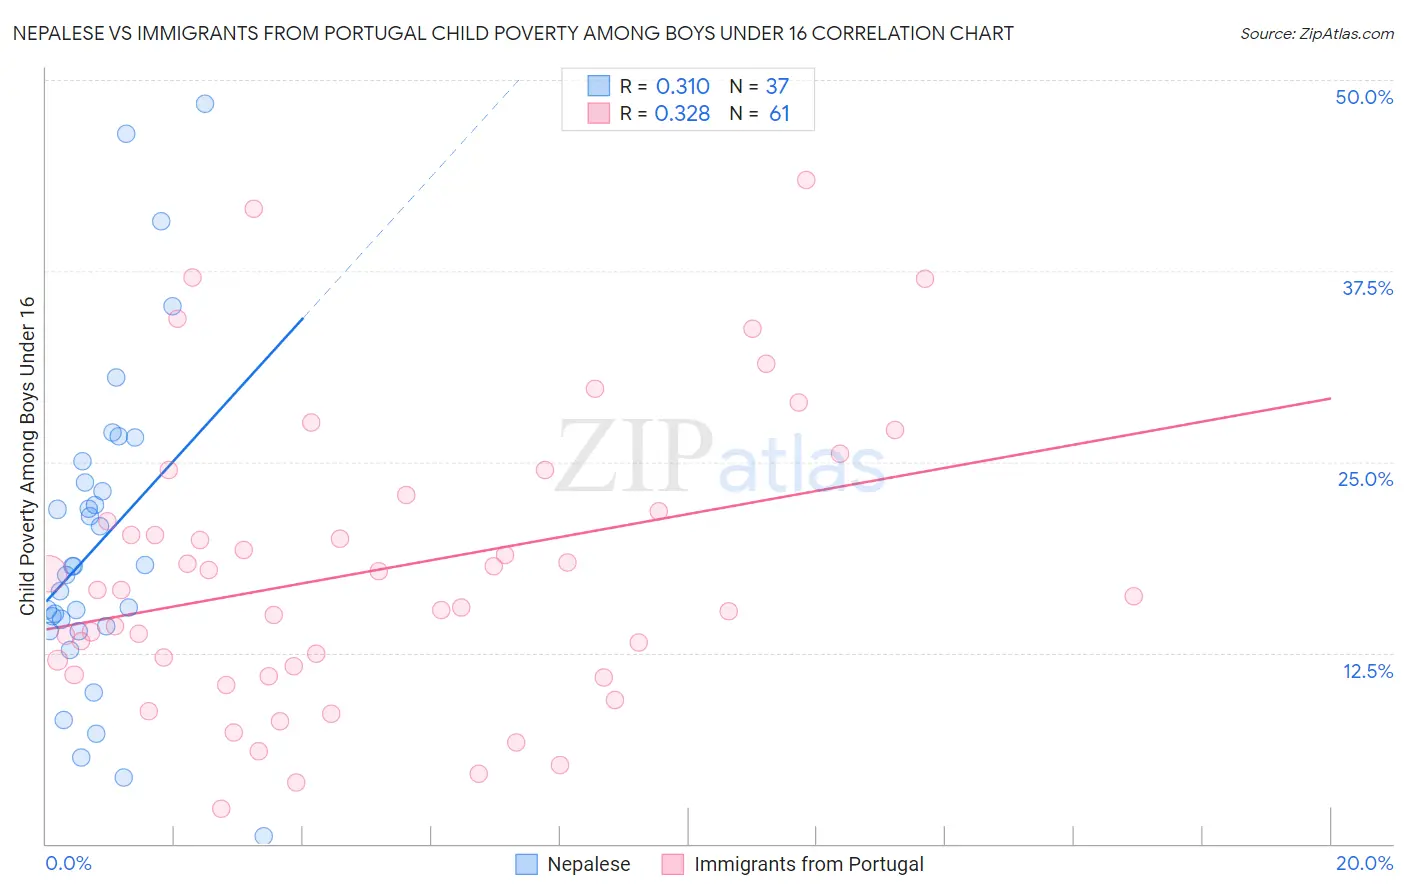
Nepalese vs Immigrants from Portugal Child Poverty Among Boys Under 16 Correlation Chart
The statistical analysis conducted on geographies consisting of 24,516,782 people shows a mild positive correlation between the proportion of Nepalese and poverty level among boys under the age of 16 in the United States with a correlation coefficient (R) of 0.310 and weighted average of 18.0%. Similarly, the statistical analysis conducted on geographies consisting of 172,490,007 people shows a mild positive correlation between the proportion of Immigrants from Portugal and poverty level among boys under the age of 16 in the United States with a correlation coefficient (R) of 0.328 and weighted average of 17.4%, a difference of 3.5%.
Child Poverty Among Boys Under 16 Correlation Summary
| Measurement | Nepalese | Immigrants from Portugal |
| Minimum | 0.48% | 2.3% |
| Maximum | 48.5% | 43.4% |
| Range | 48.0% | 41.1% |
| Mean | 19.8% | 17.9% |
| Median | 18.2% | 16.6% |
| Interquartile 25% (IQ1) | 14.1% | 11.4% |
| Interquartile 75% (IQ3) | 24.4% | 22.3% |
| Interquartile Range (IQR) | 10.3% | 10.9% |
| Standard Deviation (Sample) | 10.6% | 9.4% |
| Standard Deviation (Population) | 10.5% | 9.3% |
Demographics Similar to Nepalese and Immigrants from Portugal by Child Poverty Among Boys Under 16
In terms of child poverty among boys under 16, the demographic groups most similar to Nepalese are Cuban (17.9%, a difference of 0.47%), Pennsylvania German (17.9%, a difference of 0.56%), Immigrants from Panama (17.9%, a difference of 0.79%), Immigrants from Cambodia (17.8%, a difference of 1.3%), and Sierra Leonean (17.8%, a difference of 1.4%). Similarly, the demographic groups most similar to Immigrants from Portugal are German Russian (17.4%, a difference of 0.060%), Ugandan (17.3%, a difference of 0.33%), Immigrants from Thailand (17.5%, a difference of 0.91%), Malaysian (17.6%, a difference of 1.1%), and Alaskan Athabascan (17.6%, a difference of 1.2%).
| Demographics | Rating | Rank | Child Poverty Among Boys Under 16 |
| Ugandans | 12.5 /100 | #204 | Poor 17.3% |
| Immigrants | Portugal | 11.2 /100 | #205 | Poor 17.4% |
| German Russians | 10.9 /100 | #206 | Poor 17.4% |
| Immigrants | Thailand | 8.2 /100 | #207 | Tragic 17.5% |
| Malaysians | 7.6 /100 | #208 | Tragic 17.6% |
| Alaskan Athabascans | 7.3 /100 | #209 | Tragic 17.6% |
| Immigrants | Armenia | 6.8 /100 | #210 | Tragic 17.6% |
| Immigrants | Immigrants | 6.7 /100 | #211 | Tragic 17.6% |
| Aleuts | 6.6 /100 | #212 | Tragic 17.7% |
| Immigrants | Eastern Africa | 6.0 /100 | #213 | Tragic 17.7% |
| Panamanians | 5.9 /100 | #214 | Tragic 17.7% |
| Osage | 5.8 /100 | #215 | Tragic 17.7% |
| Moroccans | 5.6 /100 | #216 | Tragic 17.7% |
| Japanese | 5.5 /100 | #217 | Tragic 17.7% |
| Iraqis | 5.5 /100 | #218 | Tragic 17.7% |
| Sierra Leoneans | 5.3 /100 | #219 | Tragic 17.8% |
| Immigrants | Cambodia | 5.1 /100 | #220 | Tragic 17.8% |
| Immigrants | Panama | 4.3 /100 | #221 | Tragic 17.9% |
| Pennsylvania Germans | 3.9 /100 | #222 | Tragic 17.9% |
| Cubans | 3.8 /100 | #223 | Tragic 17.9% |
| Nepalese | 3.2 /100 | #224 | Tragic 18.0% |