Italian vs Native/Alaskan Female Poverty Among 18-24 Year Olds
COMPARE
Italian
Native/Alaskan
Female Poverty Among 18-24 Year Olds
Female Poverty Among 18-24 Year Olds Comparison
Italians
Natives/Alaskans
18.3%
FEMALE POVERTY AMONG 18-24 YEAR OLDS
99.9/ 100
METRIC RATING
53rd/ 347
METRIC RANK
25.4%
FEMALE POVERTY AMONG 18-24 YEAR OLDS
0.0/ 100
METRIC RATING
328th/ 347
METRIC RANK
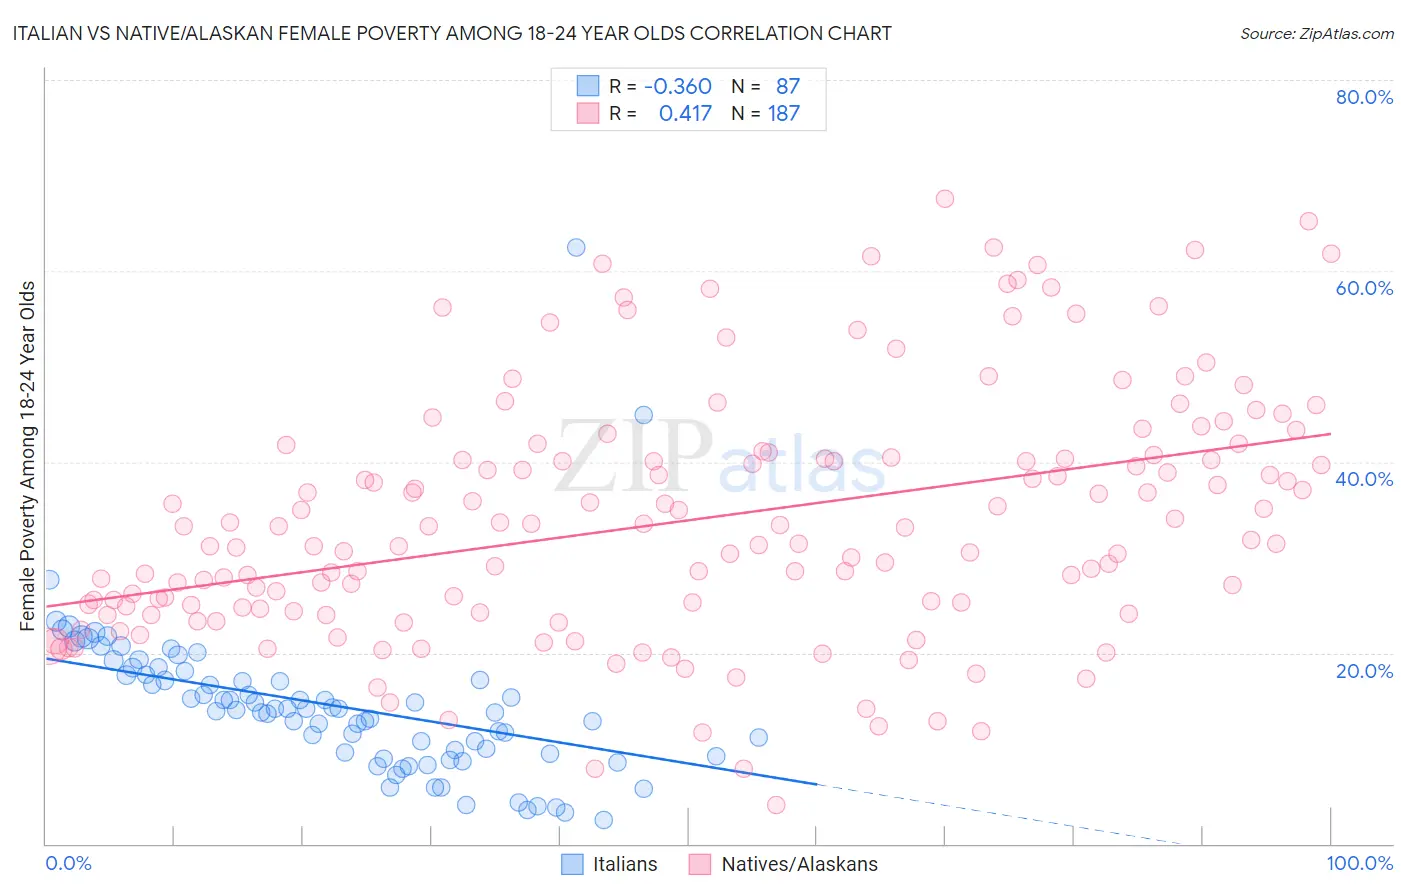
Italian vs Native/Alaskan Female Poverty Among 18-24 Year Olds Correlation Chart
The statistical analysis conducted on geographies consisting of 539,657,862 people shows a mild negative correlation between the proportion of Italians and poverty level among females between the ages 18 and 24 in the United States with a correlation coefficient (R) of -0.360 and weighted average of 18.3%. Similarly, the statistical analysis conducted on geographies consisting of 494,517,796 people shows a moderate positive correlation between the proportion of Natives/Alaskans and poverty level among females between the ages 18 and 24 in the United States with a correlation coefficient (R) of 0.417 and weighted average of 25.4%, a difference of 38.7%.
Female Poverty Among 18-24 Year Olds Correlation Summary
| Measurement | Italian | Native/Alaskan |
| Minimum | 2.4% | 4.0% |
| Maximum | 62.5% | 67.6% |
| Range | 60.1% | 63.6% |
| Mean | 14.5% | 33.8% |
| Median | 14.1% | 31.8% |
| Interquartile 25% (IQ1) | 9.5% | 24.6% |
| Interquartile 75% (IQ3) | 17.7% | 40.4% |
| Interquartile Range (IQR) | 8.2% | 15.9% |
| Standard Deviation (Sample) | 8.3% | 12.9% |
| Standard Deviation (Population) | 8.2% | 12.8% |
Similar Demographics by Female Poverty Among 18-24 Year Olds
Demographics Similar to Italians by Female Poverty Among 18-24 Year Olds
In terms of female poverty among 18-24 year olds, the demographic groups most similar to Italians are Immigrants from Ireland (18.3%, a difference of 0.090%), Immigrants from Egypt (18.4%, a difference of 0.22%), Albanian (18.4%, a difference of 0.23%), Argentinean (18.4%, a difference of 0.25%), and Immigrants from Italy (18.4%, a difference of 0.35%).
| Demographics | Rating | Rank | Female Poverty Among 18-24 Year Olds |
| Immigrants | Southern Europe | 100.0 /100 | #46 | Exceptional 18.2% |
| Asians | 100.0 /100 | #47 | Exceptional 18.2% |
| Sri Lankans | 100.0 /100 | #48 | Exceptional 18.2% |
| Bhutanese | 100.0 /100 | #49 | Exceptional 18.2% |
| Samoans | 100.0 /100 | #50 | Exceptional 18.2% |
| Immigrants | Eastern Europe | 99.9 /100 | #51 | Exceptional 18.2% |
| Immigrants | Ireland | 99.9 /100 | #52 | Exceptional 18.3% |
| Italians | 99.9 /100 | #53 | Exceptional 18.3% |
| Immigrants | Egypt | 99.9 /100 | #54 | Exceptional 18.4% |
| Albanians | 99.9 /100 | #55 | Exceptional 18.4% |
| Argentineans | 99.9 /100 | #56 | Exceptional 18.4% |
| Immigrants | Italy | 99.9 /100 | #57 | Exceptional 18.4% |
| Immigrants | Ukraine | 99.9 /100 | #58 | Exceptional 18.4% |
| Egyptians | 99.9 /100 | #59 | Exceptional 18.5% |
| Immigrants | Brazil | 99.8 /100 | #60 | Exceptional 18.5% |
Demographics Similar to Natives/Alaskans by Female Poverty Among 18-24 Year Olds
In terms of female poverty among 18-24 year olds, the demographic groups most similar to Natives/Alaskans are Ute (25.4%, a difference of 0.050%), Yakama (25.3%, a difference of 0.29%), Immigrants from Saudi Arabia (25.3%, a difference of 0.54%), German Russian (25.2%, a difference of 0.97%), and Arapaho (25.2%, a difference of 1.0%).
| Demographics | Rating | Rank | Female Poverty Among 18-24 Year Olds |
| Immigrants | Zaire | 0.0 /100 | #321 | Tragic 25.1% |
| Somalis | 0.0 /100 | #322 | Tragic 25.1% |
| Arapaho | 0.0 /100 | #323 | Tragic 25.2% |
| German Russians | 0.0 /100 | #324 | Tragic 25.2% |
| Immigrants | Saudi Arabia | 0.0 /100 | #325 | Tragic 25.3% |
| Yakama | 0.0 /100 | #326 | Tragic 25.3% |
| Ute | 0.0 /100 | #327 | Tragic 25.4% |
| Natives/Alaskans | 0.0 /100 | #328 | Tragic 25.4% |
| Cajuns | 0.0 /100 | #329 | Tragic 25.7% |
| Immigrants | Somalia | 0.0 /100 | #330 | Tragic 25.7% |
| Chippewa | 0.0 /100 | #331 | Tragic 25.9% |
| Houma | 0.0 /100 | #332 | Tragic 26.2% |
| Apache | 0.0 /100 | #333 | Tragic 26.3% |
| Pueblo | 0.0 /100 | #334 | Tragic 26.9% |
| Yup'ik | 0.0 /100 | #335 | Tragic 27.0% |