Navajo vs Nicaraguan Single Male Poverty
COMPARE
Navajo
Nicaraguan
Single Male Poverty
Single Male Poverty Comparison
Navajo
Nicaraguans
25.3%
SINGLE MALE POVERTY
0.0/ 100
METRIC RATING
345th/ 347
METRIC RANK
12.4%
SINGLE MALE POVERTY
92.1/ 100
METRIC RATING
114th/ 347
METRIC RANK
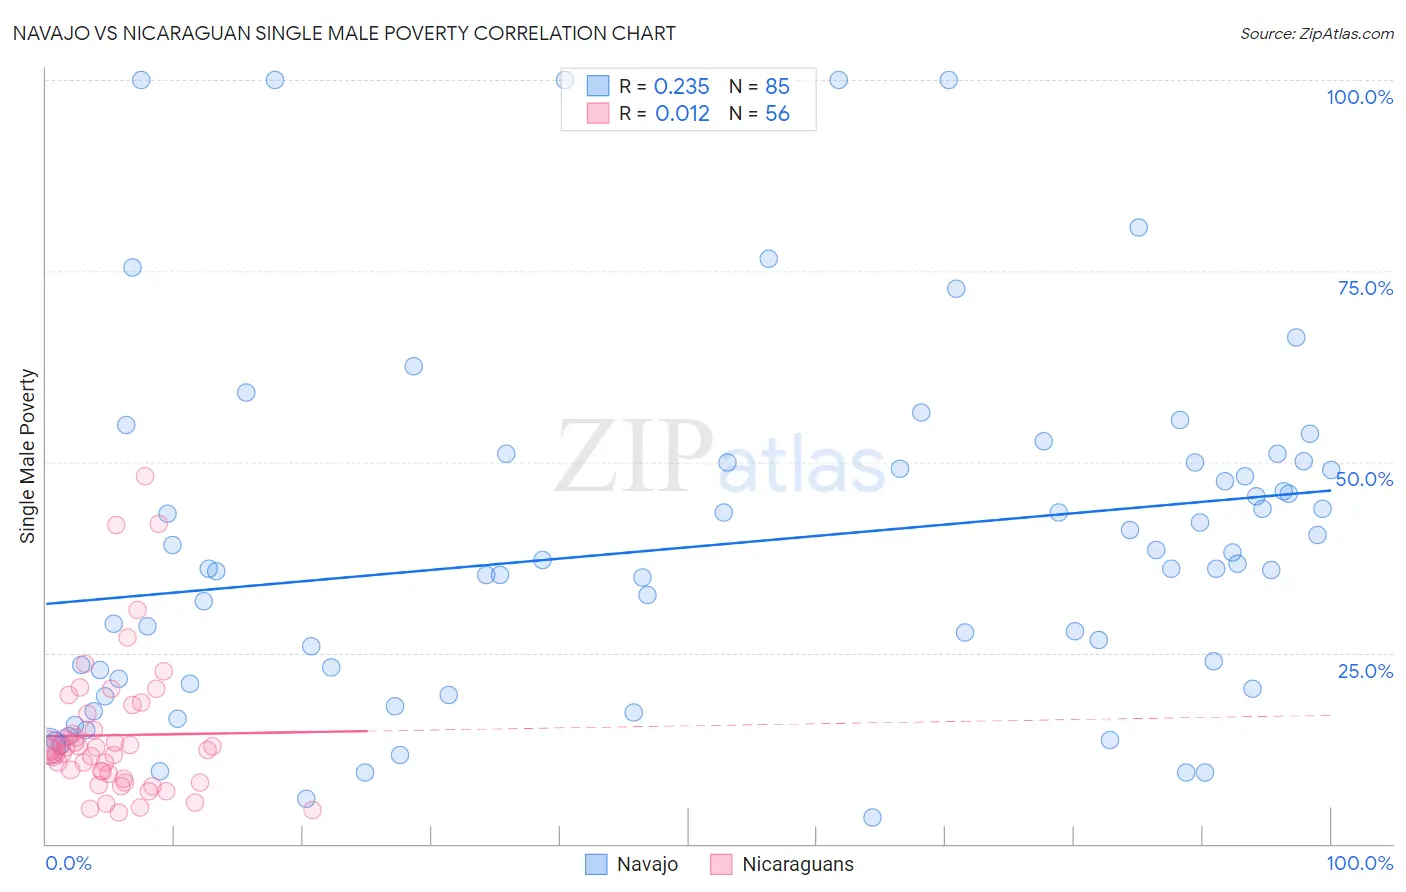
Navajo vs Nicaraguan Single Male Poverty Correlation Chart
The statistical analysis conducted on geographies consisting of 210,717,973 people shows a weak positive correlation between the proportion of Navajo and poverty level among single males in the United States with a correlation coefficient (R) of 0.235 and weighted average of 25.3%. Similarly, the statistical analysis conducted on geographies consisting of 265,372,513 people shows no correlation between the proportion of Nicaraguans and poverty level among single males in the United States with a correlation coefficient (R) of 0.012 and weighted average of 12.4%, a difference of 104.6%.
Single Male Poverty Correlation Summary
| Measurement | Navajo | Nicaraguan |
| Minimum | 3.4% | 4.1% |
| Maximum | 100.0% | 48.1% |
| Range | 96.6% | 44.0% |
| Mean | 39.0% | 14.2% |
| Median | 36.0% | 12.4% |
| Interquartile 25% (IQ1) | 20.6% | 8.9% |
| Interquartile 75% (IQ3) | 50.0% | 16.0% |
| Interquartile Range (IQR) | 29.4% | 7.1% |
| Standard Deviation (Sample) | 23.2% | 9.1% |
| Standard Deviation (Population) | 23.0% | 9.0% |
Similar Demographics by Single Male Poverty
Demographics Similar to Navajo by Single Male Poverty
In terms of single male poverty, the demographic groups most similar to Navajo are Lumbee (25.2%, a difference of 0.73%), Puerto Rican (25.1%, a difference of 1.1%), Houma (23.5%, a difference of 8.1%), Hopi (27.5%, a difference of 8.5%), and Crow (23.3%, a difference of 8.9%).
| Demographics | Rating | Rank | Single Male Poverty |
| Inupiat | 0.0 /100 | #333 | Tragic 20.0% |
| Pima | 0.0 /100 | #334 | Tragic 20.2% |
| Yuman | 0.0 /100 | #335 | Tragic 21.3% |
| Tohono O'odham | 0.0 /100 | #336 | Tragic 21.6% |
| Apache | 0.0 /100 | #337 | Tragic 21.6% |
| Pueblo | 0.0 /100 | #338 | Tragic 21.6% |
| Arapaho | 0.0 /100 | #339 | Tragic 21.9% |
| Sioux | 0.0 /100 | #340 | Tragic 22.2% |
| Crow | 0.0 /100 | #341 | Tragic 23.3% |
| Houma | 0.0 /100 | #342 | Tragic 23.5% |
| Puerto Ricans | 0.0 /100 | #343 | Tragic 25.1% |
| Lumbee | 0.0 /100 | #344 | Tragic 25.2% |
| Navajo | 0.0 /100 | #345 | Tragic 25.3% |
| Hopi | 0.0 /100 | #346 | Tragic 27.5% |
| Yup'ik | 0.0 /100 | #347 | Tragic 31.6% |
Demographics Similar to Nicaraguans by Single Male Poverty
In terms of single male poverty, the demographic groups most similar to Nicaraguans are Pakistani (12.4%, a difference of 0.050%), Immigrants from Southern Europe (12.4%, a difference of 0.11%), Immigrants from Syria (12.4%, a difference of 0.16%), Immigrants from Oceania (12.4%, a difference of 0.18%), and Kenyan (12.4%, a difference of 0.23%).
| Demographics | Rating | Rank | Single Male Poverty |
| Iraqis | 95.1 /100 | #107 | Exceptional 12.3% |
| Immigrants | Eastern Africa | 95.0 /100 | #108 | Exceptional 12.3% |
| Ugandans | 94.5 /100 | #109 | Exceptional 12.3% |
| Immigrants | Portugal | 93.6 /100 | #110 | Exceptional 12.3% |
| Immigrants | North Macedonia | 93.6 /100 | #111 | Exceptional 12.3% |
| Kenyans | 93.3 /100 | #112 | Exceptional 12.4% |
| Pakistanis | 92.4 /100 | #113 | Exceptional 12.4% |
| Nicaraguans | 92.1 /100 | #114 | Exceptional 12.4% |
| Immigrants | Southern Europe | 91.5 /100 | #115 | Exceptional 12.4% |
| Immigrants | Syria | 91.2 /100 | #116 | Exceptional 12.4% |
| Immigrants | Oceania | 91.1 /100 | #117 | Exceptional 12.4% |
| Albanians | 90.6 /100 | #118 | Exceptional 12.4% |
| Immigrants | Albania | 90.3 /100 | #119 | Exceptional 12.4% |
| Venezuelans | 89.4 /100 | #120 | Excellent 12.4% |
| Icelanders | 88.2 /100 | #121 | Excellent 12.5% |