Hawaiian vs Australian Seniors Poverty Over the Age of 65
COMPARE
Hawaiian
Australian
Seniors Poverty Over the Age of 65
Seniors Poverty Over the Age of 65 Comparison
Hawaiians
Australians
10.3%
SENIORS POVERTY OVER THE AGE OF 65
93.9/ 100
METRIC RATING
107th/ 347
METRIC RANK
9.9%
SENIORS POVERTY OVER THE AGE OF 65
98.4/ 100
METRIC RATING
69th/ 347
METRIC RANK
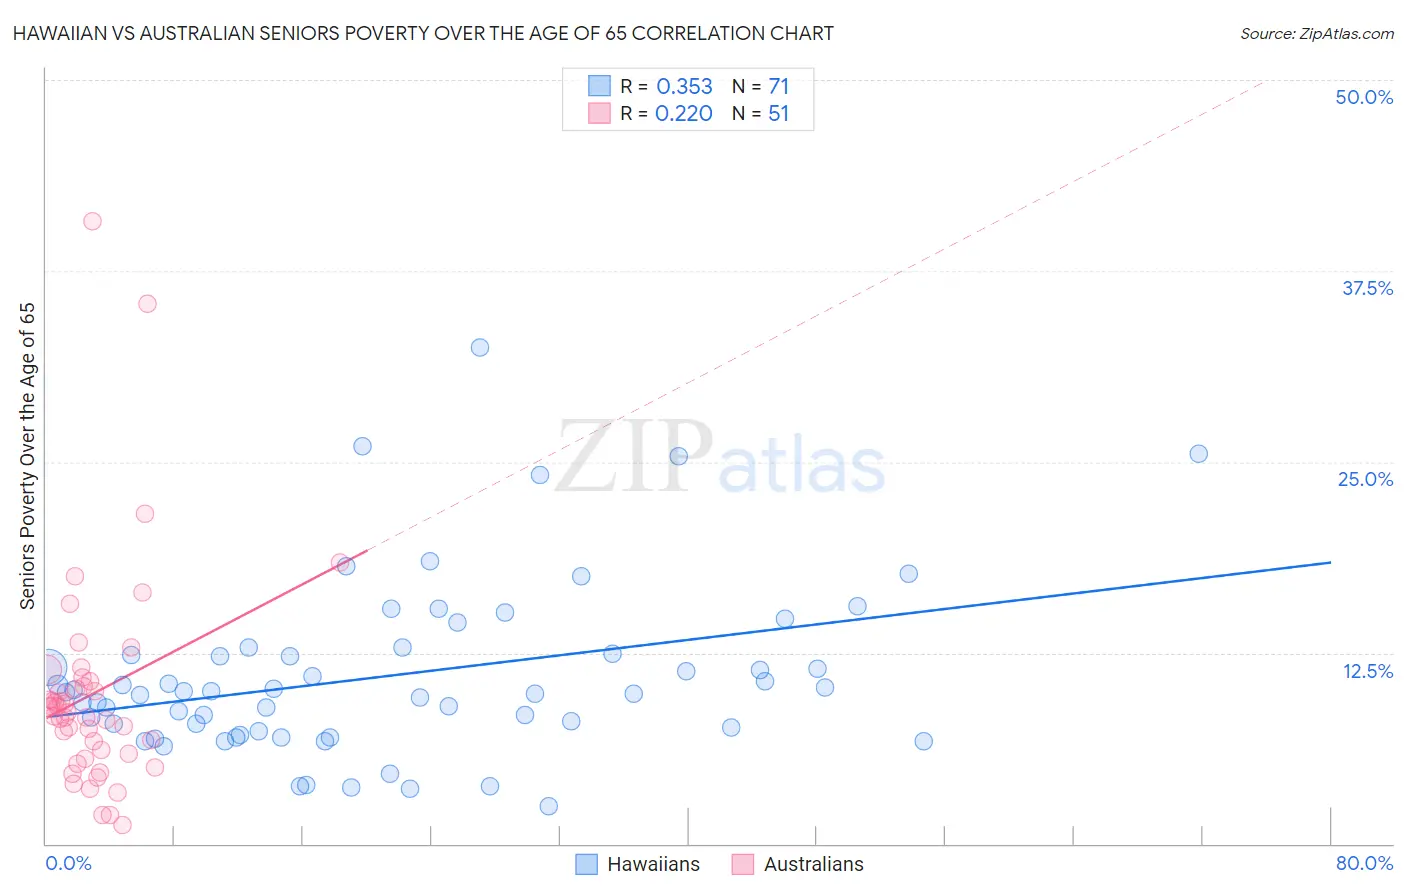
Hawaiian vs Australian Seniors Poverty Over the Age of 65 Correlation Chart
The statistical analysis conducted on geographies consisting of 326,190,217 people shows a mild positive correlation between the proportion of Hawaiians and poverty level among seniors over the age of 65 in the United States with a correlation coefficient (R) of 0.353 and weighted average of 10.3%. Similarly, the statistical analysis conducted on geographies consisting of 223,667,118 people shows a weak positive correlation between the proportion of Australians and poverty level among seniors over the age of 65 in the United States with a correlation coefficient (R) of 0.220 and weighted average of 9.9%, a difference of 3.3%.
Seniors Poverty Over the Age of 65 Correlation Summary
| Measurement | Hawaiian | Australian |
| Minimum | 2.5% | 1.2% |
| Maximum | 32.5% | 40.8% |
| Range | 30.1% | 39.6% |
| Mean | 11.0% | 9.8% |
| Median | 9.9% | 8.6% |
| Interquartile 25% (IQ1) | 7.4% | 5.9% |
| Interquartile 75% (IQ3) | 12.4% | 10.7% |
| Interquartile Range (IQR) | 5.0% | 4.8% |
| Standard Deviation (Sample) | 5.7% | 7.1% |
| Standard Deviation (Population) | 5.6% | 7.1% |
Similar Demographics by Seniors Poverty Over the Age of 65
Demographics Similar to Hawaiians by Seniors Poverty Over the Age of 65
In terms of seniors poverty over the age of 65, the demographic groups most similar to Hawaiians are Immigrants from Croatia (10.3%, a difference of 0.010%), Syrian (10.3%, a difference of 0.030%), Kenyan (10.3%, a difference of 0.070%), Aleut (10.3%, a difference of 0.090%), and South African (10.3%, a difference of 0.16%).
| Demographics | Rating | Rank | Seniors Poverty Over the Age of 65 |
| Marshallese | 95.3 /100 | #100 | Exceptional 10.2% |
| Immigrants | Jordan | 94.7 /100 | #101 | Exceptional 10.2% |
| Delaware | 94.5 /100 | #102 | Exceptional 10.2% |
| Icelanders | 94.4 /100 | #103 | Exceptional 10.3% |
| South Africans | 94.3 /100 | #104 | Exceptional 10.3% |
| Aleuts | 94.1 /100 | #105 | Exceptional 10.3% |
| Kenyans | 94.1 /100 | #106 | Exceptional 10.3% |
| Hawaiians | 93.9 /100 | #107 | Exceptional 10.3% |
| Immigrants | Croatia | 93.9 /100 | #108 | Exceptional 10.3% |
| Syrians | 93.8 /100 | #109 | Exceptional 10.3% |
| Immigrants | Zimbabwe | 93.5 /100 | #110 | Exceptional 10.3% |
| Immigrants | Belgium | 93.4 /100 | #111 | Exceptional 10.3% |
| Immigrants | Korea | 93.3 /100 | #112 | Exceptional 10.3% |
| Immigrants | Romania | 93.3 /100 | #113 | Exceptional 10.3% |
| Immigrants | Denmark | 92.7 /100 | #114 | Exceptional 10.3% |
Demographics Similar to Australians by Seniors Poverty Over the Age of 65
In terms of seniors poverty over the age of 65, the demographic groups most similar to Australians are Canadian (9.9%, a difference of 0.16%), Immigrants from Austria (9.9%, a difference of 0.37%), Immigrants from Netherlands (9.9%, a difference of 0.48%), Pennsylvania German (9.9%, a difference of 0.53%), and Samoan (10.0%, a difference of 0.57%).
| Demographics | Rating | Rank | Seniors Poverty Over the Age of 65 |
| French Canadians | 98.9 /100 | #62 | Exceptional 9.8% |
| Macedonians | 98.8 /100 | #63 | Exceptional 9.9% |
| Immigrants | North America | 98.8 /100 | #64 | Exceptional 9.9% |
| Pennsylvania Germans | 98.7 /100 | #65 | Exceptional 9.9% |
| Immigrants | Netherlands | 98.7 /100 | #66 | Exceptional 9.9% |
| Immigrants | Austria | 98.6 /100 | #67 | Exceptional 9.9% |
| Canadians | 98.5 /100 | #68 | Exceptional 9.9% |
| Australians | 98.4 /100 | #69 | Exceptional 9.9% |
| Samoans | 98.0 /100 | #70 | Exceptional 10.0% |
| Yugoslavians | 97.9 /100 | #71 | Exceptional 10.0% |
| Palestinians | 97.9 /100 | #72 | Exceptional 10.0% |
| Russians | 97.9 /100 | #73 | Exceptional 10.0% |
| Turks | 97.9 /100 | #74 | Exceptional 10.0% |
| Immigrants | Czechoslovakia | 97.8 /100 | #75 | Exceptional 10.0% |
| New Zealanders | 97.7 /100 | #76 | Exceptional 10.0% |