South American vs Jordanian Seniors Poverty Over the Age of 65
COMPARE
South American
Jordanian
Seniors Poverty Over the Age of 65
Seniors Poverty Over the Age of 65 Comparison
South Americans
Jordanians
12.5%
SENIORS POVERTY OVER THE AGE OF 65
0.2/ 100
METRIC RATING
260th/ 347
METRIC RANK
10.1%
SENIORS POVERTY OVER THE AGE OF 65
97.1/ 100
METRIC RATING
88th/ 347
METRIC RANK
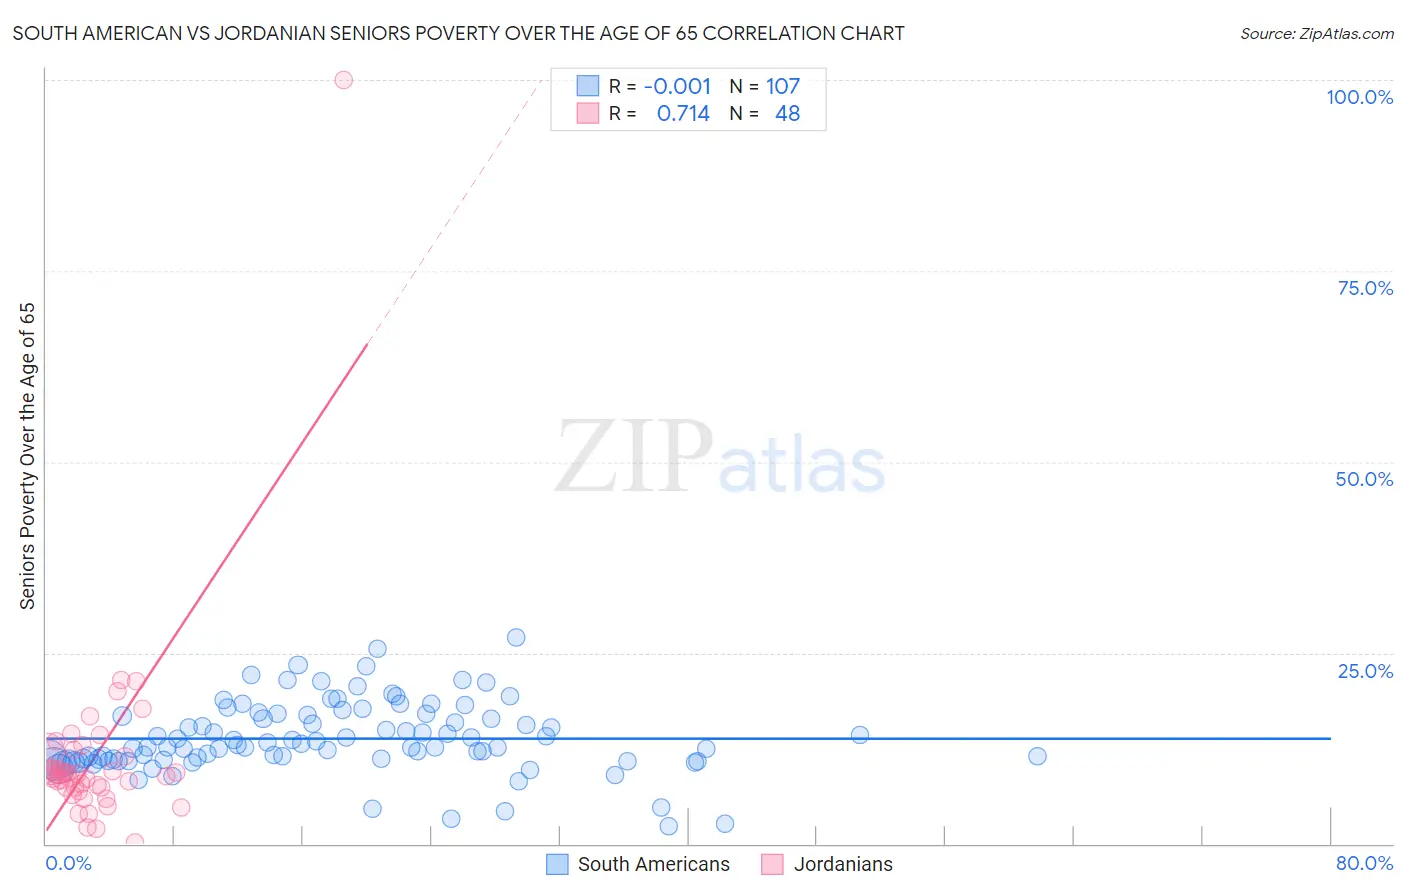
South American vs Jordanian Seniors Poverty Over the Age of 65 Correlation Chart
The statistical analysis conducted on geographies consisting of 491,284,753 people shows no correlation between the proportion of South Americans and poverty level among seniors over the age of 65 in the United States with a correlation coefficient (R) of -0.001 and weighted average of 12.5%. Similarly, the statistical analysis conducted on geographies consisting of 166,299,913 people shows a strong positive correlation between the proportion of Jordanians and poverty level among seniors over the age of 65 in the United States with a correlation coefficient (R) of 0.714 and weighted average of 10.1%, a difference of 23.7%.
Seniors Poverty Over the Age of 65 Correlation Summary
| Measurement | South American | Jordanian |
| Minimum | 2.2% | 0.093% |
| Maximum | 27.0% | 100.0% |
| Range | 24.8% | 99.9% |
| Mean | 13.8% | 11.3% |
| Median | 12.7% | 9.0% |
| Interquartile 25% (IQ1) | 11.0% | 7.3% |
| Interquartile 75% (IQ3) | 16.8% | 11.7% |
| Interquartile Range (IQR) | 5.8% | 4.4% |
| Standard Deviation (Sample) | 4.6% | 13.8% |
| Standard Deviation (Population) | 4.6% | 13.7% |
Similar Demographics by Seniors Poverty Over the Age of 65
Demographics Similar to South Americans by Seniors Poverty Over the Age of 65
In terms of seniors poverty over the age of 65, the demographic groups most similar to South Americans are Ghanaian (12.4%, a difference of 0.24%), Colombian (12.5%, a difference of 0.24%), Dutch West Indian (12.4%, a difference of 0.27%), Venezuelan (12.5%, a difference of 0.44%), and Immigrants (12.4%, a difference of 0.51%).
| Demographics | Rating | Rank | Seniors Poverty Over the Age of 65 |
| Shoshone | 0.3 /100 | #253 | Tragic 12.3% |
| Immigrants | Cambodia | 0.3 /100 | #254 | Tragic 12.4% |
| Mexican American Indians | 0.3 /100 | #255 | Tragic 12.4% |
| Immigrants | Panama | 0.2 /100 | #256 | Tragic 12.4% |
| Immigrants | Immigrants | 0.2 /100 | #257 | Tragic 12.4% |
| Dutch West Indians | 0.2 /100 | #258 | Tragic 12.4% |
| Ghanaians | 0.2 /100 | #259 | Tragic 12.4% |
| South Americans | 0.2 /100 | #260 | Tragic 12.5% |
| Colombians | 0.2 /100 | #261 | Tragic 12.5% |
| Venezuelans | 0.1 /100 | #262 | Tragic 12.5% |
| Soviet Union | 0.1 /100 | #263 | Tragic 12.6% |
| Inupiat | 0.1 /100 | #264 | Tragic 12.6% |
| Immigrants | Western Africa | 0.1 /100 | #265 | Tragic 12.6% |
| Africans | 0.1 /100 | #266 | Tragic 12.6% |
| Blackfeet | 0.1 /100 | #267 | Tragic 12.6% |
Demographics Similar to Jordanians by Seniors Poverty Over the Age of 65
In terms of seniors poverty over the age of 65, the demographic groups most similar to Jordanians are Burmese (10.1%, a difference of 0.050%), Romanian (10.1%, a difference of 0.070%), Immigrants from Bulgaria (10.1%, a difference of 0.080%), Immigrants from Afghanistan (10.1%, a difference of 0.090%), and Immigrants from Nepal (10.1%, a difference of 0.090%).
| Demographics | Rating | Rank | Seniors Poverty Over the Age of 65 |
| Immigrants | Sri Lanka | 97.3 /100 | #81 | Exceptional 10.1% |
| Immigrants | Bolivia | 97.3 /100 | #82 | Exceptional 10.1% |
| Immigrants | Poland | 97.2 /100 | #83 | Exceptional 10.1% |
| Immigrants | Afghanistan | 97.2 /100 | #84 | Exceptional 10.1% |
| Immigrants | Nepal | 97.2 /100 | #85 | Exceptional 10.1% |
| Romanians | 97.2 /100 | #86 | Exceptional 10.1% |
| Burmese | 97.2 /100 | #87 | Exceptional 10.1% |
| Jordanians | 97.1 /100 | #88 | Exceptional 10.1% |
| Immigrants | Bulgaria | 97.0 /100 | #89 | Exceptional 10.1% |
| Ukrainians | 96.9 /100 | #90 | Exceptional 10.1% |
| Puget Sound Salish | 96.9 /100 | #91 | Exceptional 10.1% |
| Immigrants | Singapore | 96.9 /100 | #92 | Exceptional 10.1% |
| Immigrants | Sweden | 96.7 /100 | #93 | Exceptional 10.1% |
| Immigrants | Germany | 96.7 /100 | #94 | Exceptional 10.1% |
| Immigrants | Japan | 96.3 /100 | #95 | Exceptional 10.1% |