Mexican vs Immigrants from Sri Lanka 8th Grade
COMPARE
Mexican
Immigrants from Sri Lanka
8th Grade
8th Grade Comparison
Mexicans
Immigrants from Sri Lanka
91.4%
8TH GRADE
0.0/ 100
METRIC RATING
339th/ 347
METRIC RANK
95.8%
8TH GRADE
64.1/ 100
METRIC RATING
163rd/ 347
METRIC RANK
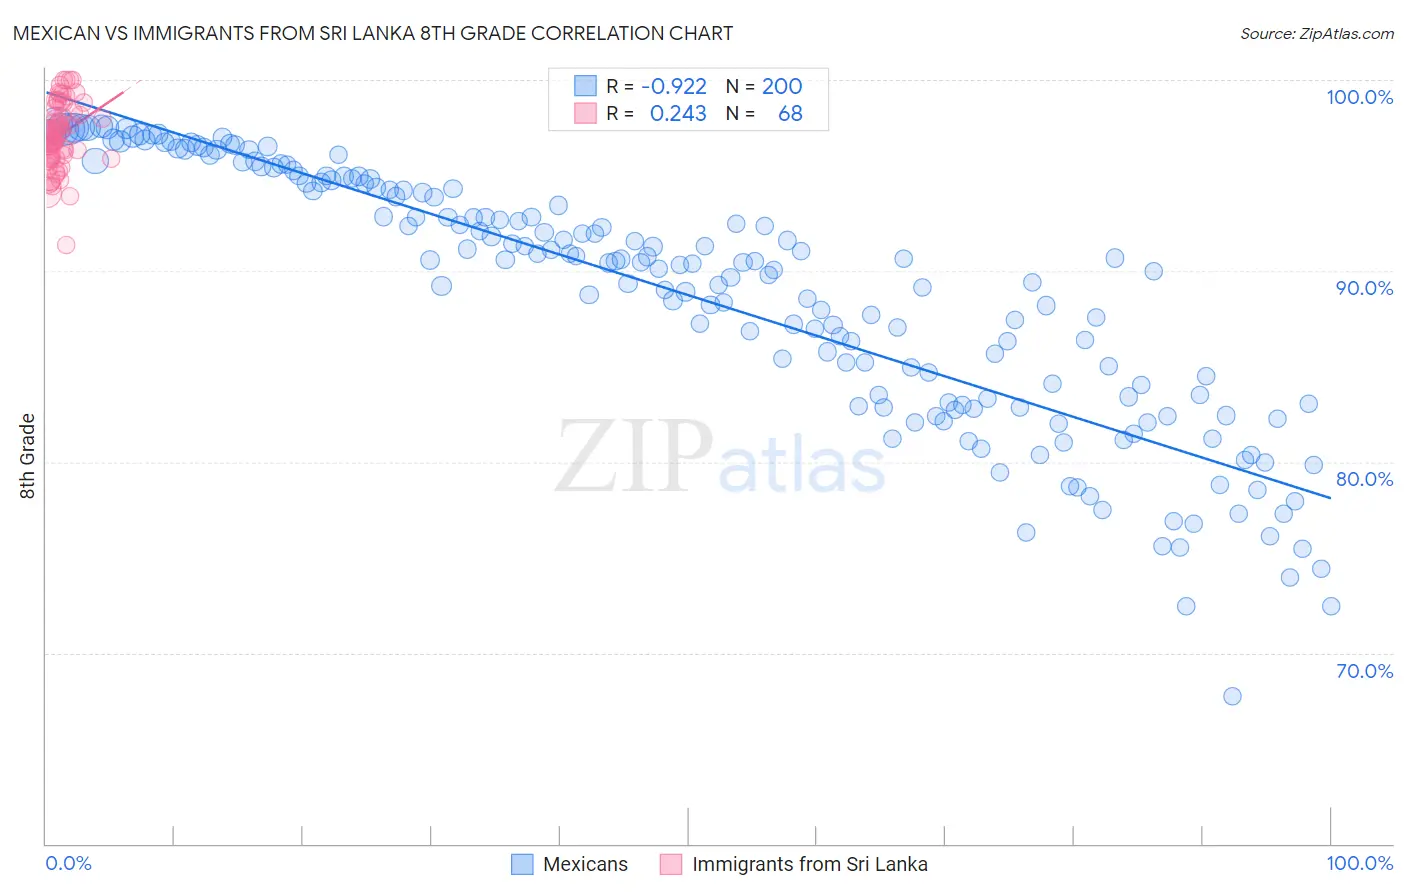
Mexican vs Immigrants from Sri Lanka 8th Grade Correlation Chart
The statistical analysis conducted on geographies consisting of 565,339,555 people shows a near-perfect negative correlation between the proportion of Mexicans and percentage of population with at least 8th grade education in the United States with a correlation coefficient (R) of -0.922 and weighted average of 91.4%. Similarly, the statistical analysis conducted on geographies consisting of 149,660,761 people shows a weak positive correlation between the proportion of Immigrants from Sri Lanka and percentage of population with at least 8th grade education in the United States with a correlation coefficient (R) of 0.243 and weighted average of 95.8%, a difference of 4.9%.
8th Grade Correlation Summary
| Measurement | Mexican | Immigrants from Sri Lanka |
| Minimum | 67.7% | 91.4% |
| Maximum | 97.7% | 100.0% |
| Range | 29.9% | 8.6% |
| Mean | 88.7% | 97.1% |
| Median | 90.4% | 97.1% |
| Interquartile 25% (IQ1) | 83.2% | 95.9% |
| Interquartile 75% (IQ3) | 94.5% | 98.4% |
| Interquartile Range (IQR) | 11.3% | 2.5% |
| Standard Deviation (Sample) | 6.7% | 1.7% |
| Standard Deviation (Population) | 6.7% | 1.7% |
Similar Demographics by 8th Grade
Demographics Similar to Mexicans by 8th Grade
In terms of 8th grade, the demographic groups most similar to Mexicans are Yakama (91.2%, a difference of 0.13%), Central American (91.6%, a difference of 0.23%), Guatemalan (91.1%, a difference of 0.24%), Immigrants from Latin America (91.7%, a difference of 0.37%), and Salvadoran (90.9%, a difference of 0.53%).
| Demographics | Rating | Rank | 8th Grade |
| Immigrants | Dominican Republic | 0.0 /100 | #332 | Tragic 92.3% |
| Hispanics or Latinos | 0.0 /100 | #333 | Tragic 92.2% |
| Immigrants | Yemen | 0.0 /100 | #334 | Tragic 92.1% |
| Mexican American Indians | 0.0 /100 | #335 | Tragic 92.1% |
| Immigrants | Honduras | 0.0 /100 | #336 | Tragic 91.9% |
| Immigrants | Latin America | 0.0 /100 | #337 | Tragic 91.7% |
| Central Americans | 0.0 /100 | #338 | Tragic 91.6% |
| Mexicans | 0.0 /100 | #339 | Tragic 91.4% |
| Yakama | 0.0 /100 | #340 | Tragic 91.2% |
| Guatemalans | 0.0 /100 | #341 | Tragic 91.1% |
| Salvadorans | 0.0 /100 | #342 | Tragic 90.9% |
| Immigrants | Guatemala | 0.0 /100 | #343 | Tragic 90.7% |
| Immigrants | Central America | 0.0 /100 | #344 | Tragic 90.4% |
| Immigrants | El Salvador | 0.0 /100 | #345 | Tragic 90.3% |
| Immigrants | Mexico | 0.0 /100 | #346 | Tragic 90.2% |
Demographics Similar to Immigrants from Sri Lanka by 8th Grade
In terms of 8th grade, the demographic groups most similar to Immigrants from Sri Lanka are Immigrants from Italy (95.8%, a difference of 0.0%), Bermudan (95.8%, a difference of 0.020%), Immigrants from Kenya (95.8%, a difference of 0.020%), Alsatian (95.8%, a difference of 0.020%), and Immigrants from Poland (95.8%, a difference of 0.020%).
| Demographics | Rating | Rank | 8th Grade |
| Ugandans | 74.1 /100 | #156 | Good 95.9% |
| Immigrants | Taiwan | 70.5 /100 | #157 | Good 95.9% |
| Arabs | 69.4 /100 | #158 | Good 95.9% |
| Immigrants | Kazakhstan | 68.4 /100 | #159 | Good 95.9% |
| Seminole | 67.7 /100 | #160 | Good 95.8% |
| Bermudans | 67.5 /100 | #161 | Good 95.8% |
| Immigrants | Kenya | 67.2 /100 | #162 | Good 95.8% |
| Immigrants | Sri Lanka | 64.1 /100 | #163 | Good 95.8% |
| Immigrants | Italy | 63.5 /100 | #164 | Good 95.8% |
| Alsatians | 61.4 /100 | #165 | Good 95.8% |
| Immigrants | Poland | 61.1 /100 | #166 | Good 95.8% |
| Spaniards | 60.0 /100 | #167 | Good 95.8% |
| Immigrants | Ukraine | 59.5 /100 | #168 | Average 95.8% |
| Immigrants | Iran | 58.6 /100 | #169 | Average 95.8% |
| Ute | 58.5 /100 | #170 | Average 95.8% |