Mexican vs Sierra Leonean Single Male Poverty
COMPARE
Mexican
Sierra Leonean
Single Male Poverty
Single Male Poverty Comparison
Mexicans
Sierra Leoneans
14.0%
SINGLE MALE POVERTY
0.1/ 100
METRIC RATING
272nd/ 347
METRIC RANK
12.6%
SINGLE MALE POVERTY
73.0/ 100
METRIC RATING
149th/ 347
METRIC RANK
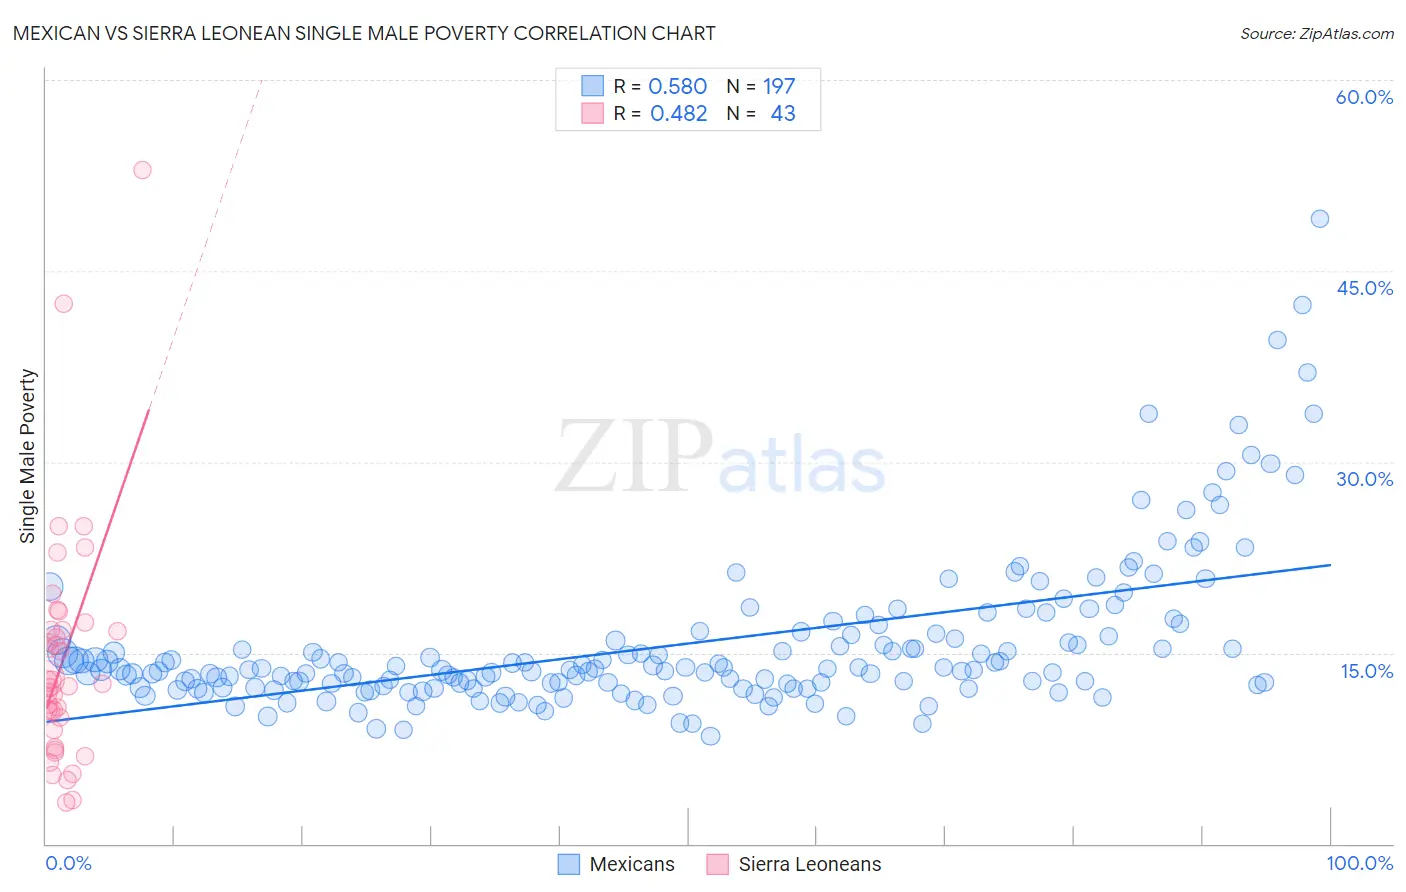
Mexican vs Sierra Leonean Single Male Poverty Correlation Chart
The statistical analysis conducted on geographies consisting of 471,672,286 people shows a substantial positive correlation between the proportion of Mexicans and poverty level among single males in the United States with a correlation coefficient (R) of 0.580 and weighted average of 14.0%. Similarly, the statistical analysis conducted on geographies consisting of 80,419,123 people shows a moderate positive correlation between the proportion of Sierra Leoneans and poverty level among single males in the United States with a correlation coefficient (R) of 0.482 and weighted average of 12.6%, a difference of 10.7%.
Single Male Poverty Correlation Summary
| Measurement | Mexican | Sierra Leonean |
| Minimum | 8.4% | 3.2% |
| Maximum | 49.1% | 52.9% |
| Range | 40.7% | 49.7% |
| Mean | 15.6% | 14.5% |
| Median | 13.7% | 12.5% |
| Interquartile 25% (IQ1) | 12.3% | 8.9% |
| Interquartile 75% (IQ3) | 16.2% | 16.8% |
| Interquartile Range (IQR) | 3.9% | 7.9% |
| Standard Deviation (Sample) | 6.1% | 9.3% |
| Standard Deviation (Population) | 6.1% | 9.2% |
Similar Demographics by Single Male Poverty
Demographics Similar to Mexicans by Single Male Poverty
In terms of single male poverty, the demographic groups most similar to Mexicans are Irish (14.0%, a difference of 0.060%), Immigrants from Saudi Arabia (14.0%, a difference of 0.090%), Scottish (14.0%, a difference of 0.10%), Immigrants from Mexico (13.9%, a difference of 0.26%), and German (13.9%, a difference of 0.33%).
| Demographics | Rating | Rank | Single Male Poverty |
| Immigrants | Congo | 0.2 /100 | #265 | Tragic 13.9% |
| Immigrants | Cabo Verde | 0.1 /100 | #266 | Tragic 13.9% |
| Germans | 0.1 /100 | #267 | Tragic 13.9% |
| Immigrants | Mexico | 0.1 /100 | #268 | Tragic 13.9% |
| Scottish | 0.1 /100 | #269 | Tragic 14.0% |
| Immigrants | Saudi Arabia | 0.1 /100 | #270 | Tragic 14.0% |
| Irish | 0.1 /100 | #271 | Tragic 14.0% |
| Mexicans | 0.1 /100 | #272 | Tragic 14.0% |
| Welsh | 0.1 /100 | #273 | Tragic 14.0% |
| Hondurans | 0.1 /100 | #274 | Tragic 14.0% |
| English | 0.1 /100 | #275 | Tragic 14.1% |
| Dutch | 0.1 /100 | #276 | Tragic 14.1% |
| Immigrants | Honduras | 0.0 /100 | #277 | Tragic 14.1% |
| Slovaks | 0.0 /100 | #278 | Tragic 14.1% |
| Indonesians | 0.0 /100 | #279 | Tragic 14.1% |
Demographics Similar to Sierra Leoneans by Single Male Poverty
In terms of single male poverty, the demographic groups most similar to Sierra Leoneans are Immigrants from Panama (12.6%, a difference of 0.060%), Yugoslavian (12.6%, a difference of 0.070%), Immigrants from Hungary (12.6%, a difference of 0.070%), Australian (12.6%, a difference of 0.11%), and Malaysian (12.6%, a difference of 0.12%).
| Demographics | Rating | Rank | Single Male Poverty |
| Immigrants | Uganda | 75.9 /100 | #142 | Good 12.6% |
| Immigrants | France | 75.8 /100 | #143 | Good 12.6% |
| Hawaiians | 75.1 /100 | #144 | Good 12.6% |
| Immigrants | Lebanon | 75.0 /100 | #145 | Good 12.6% |
| Native Hawaiians | 75.0 /100 | #146 | Good 12.6% |
| Malaysians | 74.8 /100 | #147 | Good 12.6% |
| Yugoslavians | 73.9 /100 | #148 | Good 12.6% |
| Sierra Leoneans | 73.0 /100 | #149 | Good 12.6% |
| Immigrants | Panama | 72.1 /100 | #150 | Good 12.6% |
| Immigrants | Hungary | 71.9 /100 | #151 | Good 12.6% |
| Australians | 71.4 /100 | #152 | Good 12.6% |
| Immigrants | Immigrants | 70.1 /100 | #153 | Good 12.7% |
| Immigrants | Scotland | 68.9 /100 | #154 | Good 12.7% |
| Immigrants | Spain | 68.7 /100 | #155 | Good 12.7% |
| Vietnamese | 67.9 /100 | #156 | Good 12.7% |