Mexican American Indian vs Israeli Child Poverty Among Boys Under 16
COMPARE
Mexican American Indian
Israeli
Child Poverty Among Boys Under 16
Child Poverty Among Boys Under 16 Comparison
Mexican American Indians
Israelis
19.4%
CHILD POVERTY AMONG BOYS UNDER 16
0.2/ 100
METRIC RATING
257th/ 347
METRIC RANK
15.9%
CHILD POVERTY AMONG BOYS UNDER 16
76.5/ 100
METRIC RATING
156th/ 347
METRIC RANK
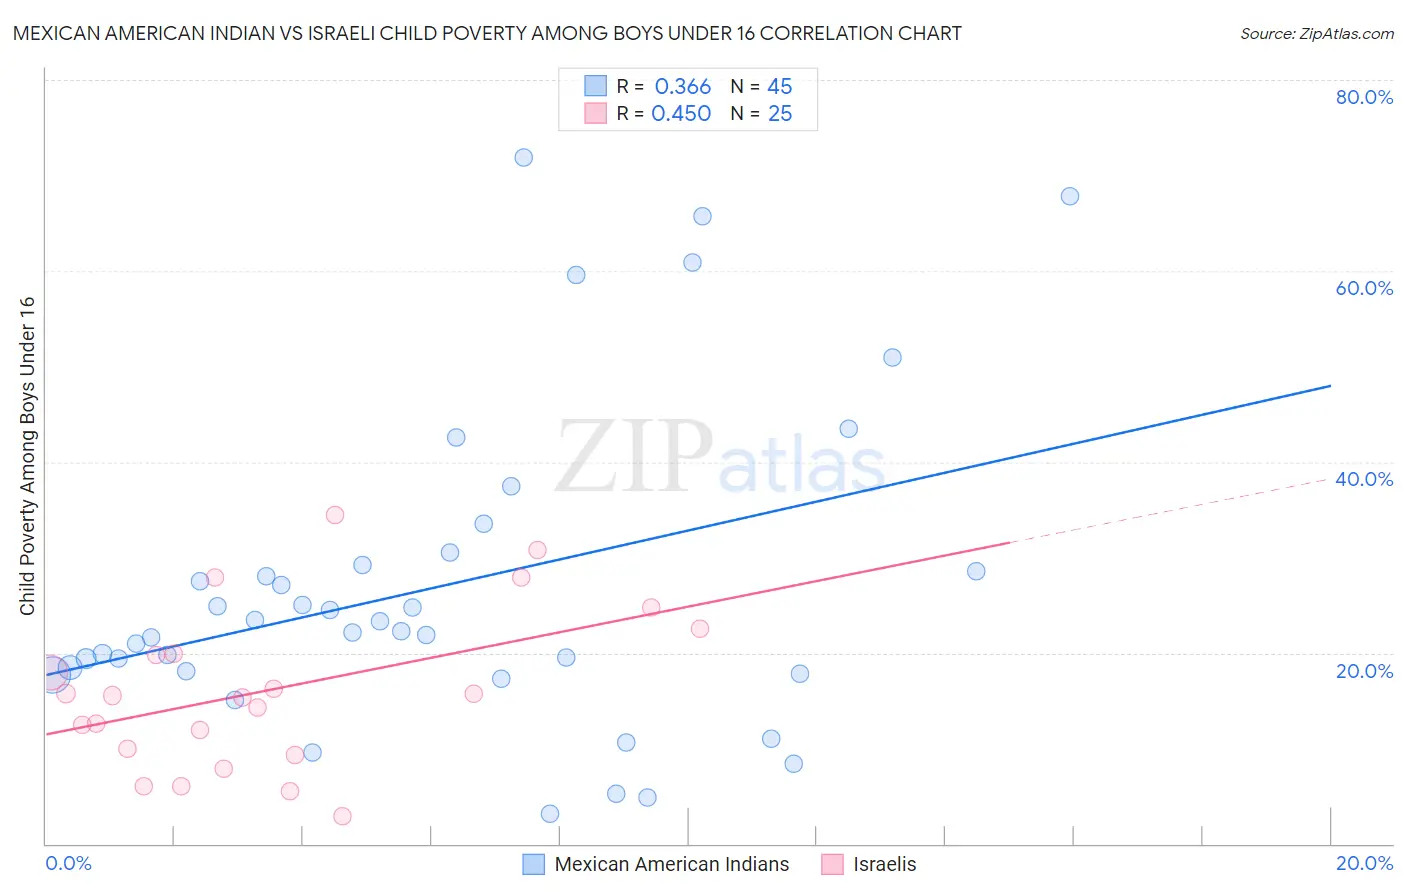
Mexican American Indian vs Israeli Child Poverty Among Boys Under 16 Correlation Chart
The statistical analysis conducted on geographies consisting of 315,460,989 people shows a mild positive correlation between the proportion of Mexican American Indians and poverty level among boys under the age of 16 in the United States with a correlation coefficient (R) of 0.366 and weighted average of 19.4%. Similarly, the statistical analysis conducted on geographies consisting of 208,424,853 people shows a moderate positive correlation between the proportion of Israelis and poverty level among boys under the age of 16 in the United States with a correlation coefficient (R) of 0.450 and weighted average of 15.9%, a difference of 21.9%.
Child Poverty Among Boys Under 16 Correlation Summary
| Measurement | Mexican American Indian | Israeli |
| Minimum | 3.1% | 2.9% |
| Maximum | 71.9% | 34.4% |
| Range | 68.8% | 31.5% |
| Mean | 27.0% | 16.1% |
| Median | 22.3% | 15.5% |
| Interquartile 25% (IQ1) | 17.9% | 9.6% |
| Interquartile 75% (IQ3) | 29.9% | 21.2% |
| Interquartile Range (IQR) | 11.9% | 11.6% |
| Standard Deviation (Sample) | 16.8% | 8.3% |
| Standard Deviation (Population) | 16.6% | 8.2% |
Similar Demographics by Child Poverty Among Boys Under 16
Demographics Similar to Mexican American Indians by Child Poverty Among Boys Under 16
In terms of child poverty among boys under 16, the demographic groups most similar to Mexican American Indians are Potawatomi (19.4%, a difference of 0.020%), Spanish American (19.4%, a difference of 0.030%), Shoshone (19.4%, a difference of 0.13%), Immigrants from Ghana (19.4%, a difference of 0.15%), and Immigrants from Liberia (19.3%, a difference of 0.21%).
| Demographics | Rating | Rank | Child Poverty Among Boys Under 16 |
| Immigrants | Burma/Myanmar | 0.2 /100 | #250 | Tragic 19.2% |
| French American Indians | 0.2 /100 | #251 | Tragic 19.2% |
| Immigrants | Western Africa | 0.2 /100 | #252 | Tragic 19.3% |
| Liberians | 0.2 /100 | #253 | Tragic 19.3% |
| Trinidadians and Tobagonians | 0.2 /100 | #254 | Tragic 19.3% |
| Ecuadorians | 0.2 /100 | #255 | Tragic 19.3% |
| Immigrants | Liberia | 0.2 /100 | #256 | Tragic 19.3% |
| Mexican American Indians | 0.2 /100 | #257 | Tragic 19.4% |
| Potawatomi | 0.2 /100 | #258 | Tragic 19.4% |
| Spanish Americans | 0.2 /100 | #259 | Tragic 19.4% |
| Shoshone | 0.2 /100 | #260 | Tragic 19.4% |
| Immigrants | Ghana | 0.2 /100 | #261 | Tragic 19.4% |
| Immigrants | Guyana | 0.1 /100 | #262 | Tragic 19.5% |
| Ottawa | 0.1 /100 | #263 | Tragic 19.5% |
| Iroquois | 0.1 /100 | #264 | Tragic 19.6% |
Demographics Similar to Israelis by Child Poverty Among Boys Under 16
In terms of child poverty among boys under 16, the demographic groups most similar to Israelis are French Canadian (15.9%, a difference of 0.010%), Immigrants from Nepal (15.9%, a difference of 0.090%), Yugoslavian (15.9%, a difference of 0.10%), Syrian (15.9%, a difference of 0.16%), and Immigrants from Chile (15.9%, a difference of 0.27%).
| Demographics | Rating | Rank | Child Poverty Among Boys Under 16 |
| Slovaks | 80.3 /100 | #149 | Excellent 15.8% |
| Immigrants | Jordan | 80.2 /100 | #150 | Excellent 15.8% |
| Puget Sound Salish | 79.8 /100 | #151 | Good 15.8% |
| Immigrants | Venezuela | 79.5 /100 | #152 | Good 15.8% |
| French | 78.7 /100 | #153 | Good 15.8% |
| Syrians | 77.5 /100 | #154 | Good 15.9% |
| French Canadians | 76.6 /100 | #155 | Good 15.9% |
| Israelis | 76.5 /100 | #156 | Good 15.9% |
| Immigrants | Nepal | 76.0 /100 | #157 | Good 15.9% |
| Yugoslavians | 75.9 /100 | #158 | Good 15.9% |
| Immigrants | Chile | 74.8 /100 | #159 | Good 15.9% |
| Immigrants | Northern Africa | 71.3 /100 | #160 | Good 16.0% |
| Immigrants | Oceania | 71.3 /100 | #161 | Good 16.0% |
| Guamanians/Chamorros | 69.6 /100 | #162 | Good 16.1% |
| Costa Ricans | 68.1 /100 | #163 | Good 16.1% |