Mexican American Indian vs Cajun Child Poverty Among Boys Under 16

COMPARE

Mexican American Indian
Race
Ancestry
AfghanAfricanAlaska NativeAlaskan AthabascanAlbanianAleutAlsatianAmericanApacheArabArapahoArgentineanArmenianAssyrian/Chaldean/SyriacAustralianAustrianBahamianBangladeshiBarbadianBasqueBelgianBelizeanBermudanBhutaneseBlackfeetBolivianBrazilianBritishBritish West IndianBulgarianBurmeseCambodianCanadianCape VerdeanCarpatho RusynCelticCentral AmericanCentral American IndianCherokeeCheyenneChickasawChileanChineseChippewaChoctawColombianColvilleComancheCosta RicanCreeCreekCroatianCrowCubanCypriotCzechCzechoslovakianDanishDelawareDominicanDutchDutch West IndianEastern EuropeanEcuadorianEgyptianEnglishEstonianEthiopianEuropeanFijianFilipinoFinnishFrenchFrench American IndianFrench CanadianGermanGerman RussianGhanaianGreekGuamanian/ChamorroGuatemalanGuyaneseHaitianHmongHonduranHopiHoumaHungarianIcelanderIndian (Asian)IndonesianInupiatIranianIraqiIrishIroquoisIsraeliItalianJamaicanJapaneseJordanianKenyanKiowaKoreanLaotianLatvianLebaneseLiberianLithuanianLumbeeLuxembourgerMacedonianMalaysianMalteseMarshalleseMenomineeMexicanMexican American IndianMongolianMoroccanNative HawaiianNavajoNepaleseNew ZealanderNicaraguanNigerianNorthern EuropeanNorwegianOkinawanOsageOttawaPaiutePakistaniPalestinianPanamanianParaguayanPennsylvania GermanPeruvianPimaPolishPortuguesePotawatomiPuebloPuerto RicanPuget Sound SalishRomanianRussianSalvadoranSamoanScandinavianScotch-IrishScottishSeminoleSenegaleseSerbianShoshoneSierra LeoneanSiouxSlavicSlovakSloveneSomaliSouth AfricanSouth AmericanSouth American IndianSoviet UnionSpaniardSpanishSpanish AmericanSpanish American IndianSri LankanSubsaharan AfricanSudaneseSwedishSwissSyrianTaiwaneseThaiTlingit-HaidaTohono O'OdhamTonganTrinidadian and TobagonianTsimshianTurkishU.S. Virgin IslanderUgandanUkrainianUruguayanUteVenezuelanVietnameseWelshWest IndianYakamaYaquiYugoslavianYumanYup'ikZimbabwean
Immigration
NonimmigrantsImmigrantsAfghanistanAfricaAlbaniaArgentinaArmeniaAsiaAustraliaAustriaBahamasBangladeshBarbadosBelarusBelgiumBelizeBoliviaBosnia and HerzegovinaBrazilBulgariaBurma/MyanmarCabo VerdeCambodiaCameroonCanadaCaribbeanCentral AmericaChileChinaColombiaCongoCosta RicaCroatiaCubaCzechoslovakiaDenmarkDominicaDominican RepublicEastern AfricaEastern AsiaEastern EuropeEcuadorEgyptEl SalvadorEnglandEritreaEthiopiaEuropeFijiFranceGermanyGhanaGreeceGrenadaGuatemalaGuyanaHaitiHondurasHong KongHungaryIndiaIndonesiaIranIraqIrelandIsraelItalyJamaicaJapanJordanKazakhstanKenyaKoreaKuwaitLaosLatin AmericaLatviaLebanonLiberiaLithuaniaMalaysiaMexicoMicronesiaMiddle AfricaMoldovaMoroccoNepalNetherlandsNicaraguaNigeriaNorth AmericaNorth MacedoniaNorthern AfricaNorthern EuropeNorwayOceaniaPakistanPanamaPeruPhilippinesPolandPortugalRomaniaRussiaSaudi ArabiaScotlandSenegalSerbiaSierra LeoneSingaporeSomaliaSouth AfricaSouth AmericaSouth Central AsiaSouth Eastern AsiaSouthern EuropeSpainSri LankaSt. Vincent and the GrenadinesSudanSwedenSwitzerlandSyriaTaiwanThailandTrinidad and TobagoTurkeyUgandaUkraineUruguayUzbekistanVenezuelaVietnamWest IndiesWestern AfricaWestern AsiaWestern EuropeYemenZaireZimbabweAzores
Cajun
Race
Ancestry
AfghanAfricanAlaska NativeAlaskan AthabascanAlbanianAleutAlsatianAmericanApacheArabArapahoArgentineanArmenianAssyrian/Chaldean/SyriacAustralianAustrianBahamianBangladeshiBarbadianBasqueBelgianBelizeanBermudanBhutaneseBlackfeetBolivianBrazilianBritishBritish West IndianBulgarianBurmeseCajunCambodianCanadianCape VerdeanCarpatho RusynCelticCentral AmericanCentral American IndianCherokeeCheyenneChickasawChileanChineseChippewaChoctawColombianColvilleComancheCosta RicanCreeCreekCroatianCrowCubanCypriotCzechCzechoslovakianDanishDelawareDominicanDutchDutch West IndianEastern EuropeanEcuadorianEgyptianEnglishEstonianEthiopianEuropeanFijianFilipinoFinnishFrenchFrench American IndianFrench CanadianGermanGerman RussianGhanaianGreekGuamanian/ChamorroGuatemalanGuyaneseHaitianHmongHonduranHopiHoumaHungarianIcelanderIndian (Asian)IndonesianInupiatIranianIraqiIrishIroquoisIsraeliItalianJamaicanJapaneseJordanianKenyanKiowaKoreanLaotianLatvianLebaneseLiberianLithuanianLumbeeLuxembourgerMacedonianMalaysianMalteseMarshalleseMenomineeMexicanMongolianMoroccanNative HawaiianNavajoNepaleseNew ZealanderNicaraguanNigerianNorthern EuropeanNorwegianOkinawanOsageOttawaPaiutePakistaniPalestinianPanamanianParaguayanPennsylvania GermanPeruvianPimaPolishPortuguesePotawatomiPuebloPuerto RicanPuget Sound SalishRomanianRussianSalvadoranSamoanScandinavianScotch-IrishScottishSeminoleSenegaleseSerbianShoshoneSierra LeoneanSiouxSlavicSlovakSloveneSomaliSouth AfricanSouth AmericanSouth American IndianSoviet UnionSpaniardSpanishSpanish AmericanSpanish American IndianSri LankanSubsaharan AfricanSudaneseSwedishSwissSyrianTaiwaneseThaiTlingit-HaidaTohono O'OdhamTonganTrinidadian and TobagonianTsimshianTurkishU.S. Virgin IslanderUgandanUkrainianUruguayanUteVenezuelanVietnameseWelshWest IndianYakamaYaquiYugoslavianYumanYup'ikZimbabwean
Immigration
NonimmigrantsImmigrantsAfghanistanAfricaAlbaniaArgentinaArmeniaAsiaAustraliaAustriaBahamasBangladeshBarbadosBelarusBelgiumBelizeBoliviaBosnia and HerzegovinaBrazilBulgariaBurma/MyanmarCabo VerdeCambodiaCameroonCanadaCaribbeanCentral AmericaChileChinaColombiaCongoCosta RicaCroatiaCubaCzechoslovakiaDenmarkDominicaDominican RepublicEastern AfricaEastern AsiaEastern EuropeEcuadorEgyptEl SalvadorEnglandEritreaEthiopiaEuropeFijiFranceGermanyGhanaGreeceGrenadaGuatemalaGuyanaHaitiHondurasHong KongHungaryIndiaIndonesiaIranIraqIrelandIsraelItalyJamaicaJapanJordanKazakhstanKenyaKoreaKuwaitLaosLatin AmericaLatviaLebanonLiberiaLithuaniaMalaysiaMexicoMicronesiaMiddle AfricaMoldovaMoroccoNepalNetherlandsNicaraguaNigeriaNorth AmericaNorth MacedoniaNorthern AfricaNorthern EuropeNorwayOceaniaPakistanPanamaPeruPhilippinesPolandPortugalRomaniaRussiaSaudi ArabiaScotlandSenegalSerbiaSierra LeoneSingaporeSomaliaSouth AfricaSouth AmericaSouth Central AsiaSouth Eastern AsiaSouthern EuropeSpainSri LankaSt. Vincent and the GrenadinesSudanSwedenSwitzerlandSyriaTaiwanThailandTrinidad and TobagoTurkeyUgandaUkraineUruguayUzbekistanVenezuelaVietnamWest IndiesWestern AfricaWestern AsiaWestern EuropeYemenZaireZimbabweAzores
Child Poverty Among Boys Under 16
Income
Poverty
Unemployment
Labor Participation
Family Structure
Vehicle Availability
Education Level
Disability

Child Poverty Among Boys Under 16 Comparison

Mexican American Indians

Cajuns

Tragic
Tragic
19.4%
CHILD POVERTY AMONG BOYS UNDER 16
0.2/ 100
METRIC RATING
257th/ 347
METRIC RANK
22.2%
CHILD POVERTY AMONG BOYS UNDER 16
0.0/ 100
METRIC RATING
321st/ 347
METRIC RANK

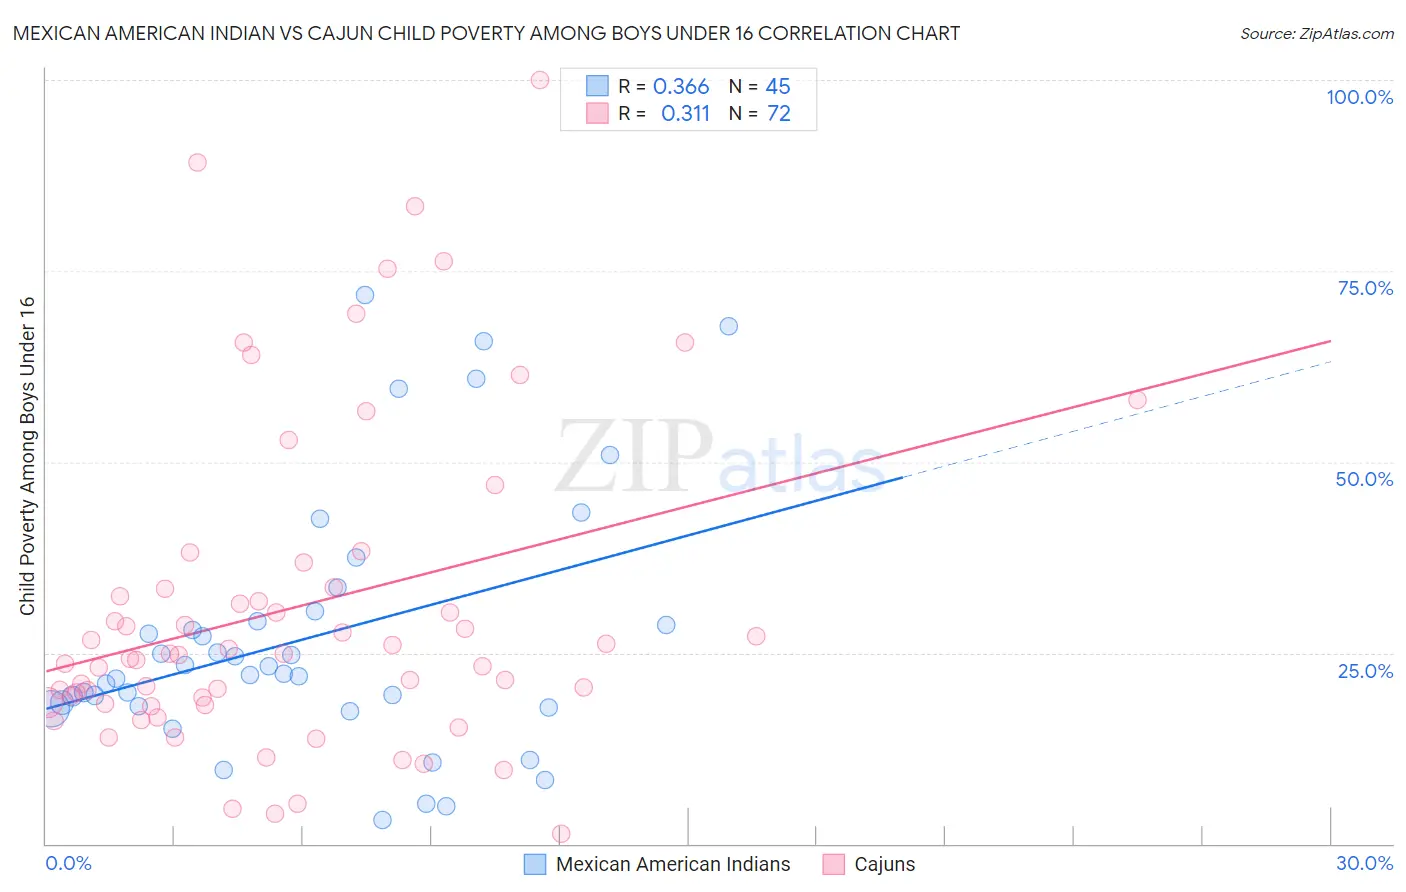
Mexican American Indian vs Cajun Child Poverty Among Boys Under 16 Correlation Chart

The statistical analysis conducted on geographies consisting of 315,460,989 people shows a mild positive correlation between the proportion of Mexican American Indians and poverty level among boys under the age of 16 in the United States with a correlation coefficient (R) of 0.366 and weighted average of 19.4%. Similarly, the statistical analysis conducted on geographies consisting of 148,584,724 people shows a mild positive correlation between the proportion of Cajuns and poverty level among boys under the age of 16 in the United States with a correlation coefficient (R) of 0.311 and weighted average of 22.2%, a difference of 14.6%.
Mexican American Indian vs Cajun Child Poverty Among Boys Under 16

Child Poverty Among Boys Under 16 Correlation Summary

MeasurementMexican American IndianCajun
Minimum3.1%1.3%
Maximum71.9%100.0%
Range68.8%98.7%
Mean27.0%30.9%
Median22.3%24.8%
Interquartile 25% (IQ1)17.9%18.5%
Interquartile 75% (IQ3)29.9%33.5%
Interquartile Range (IQR)11.9%15.0%
Standard Deviation (Sample)16.8%21.2%
Standard Deviation (Population)16.6%21.1%

Similar Demographics by Child Poverty Among Boys Under 16

Demographics Similar to Mexican American Indians by Child Poverty Among Boys Under 16

In terms of child poverty among boys under 16, the demographic groups most similar to Mexican American Indians are Potawatomi (19.4%, a difference of 0.020%), Spanish American (19.4%, a difference of 0.030%), Shoshone (19.4%, a difference of 0.13%), Immigrants from Ghana (19.4%, a difference of 0.15%), and Immigrants from Liberia (19.3%, a difference of 0.21%).
DemographicsRating | RankChild Poverty Among Boys Under 16
Immigrants | Burma/Myanmar
0.2
/100
|
#250
Tragic
19.2%
French American Indians
0.2
/100
|
#251
Tragic
19.2%
Immigrants | Western Africa
0.2
/100
|
#252
Tragic
19.3%
Liberians
0.2
/100
|
#253
Tragic
19.3%
Trinidadians and Tobagonians
0.2
/100
|
#254
Tragic
19.3%
Ecuadorians
0.2
/100
|
#255
Tragic
19.3%
Immigrants | Liberia
0.2
/100
|
#256
Tragic
19.3%
Mexican American Indians
0.2
/100
|
#257
Tragic
19.4%
Potawatomi
0.2
/100
|
#258
Tragic
19.4%
Spanish Americans
0.2
/100
|
#259
Tragic
19.4%
Shoshone
0.2
/100
|
#260
Tragic
19.4%
Immigrants | Ghana
0.2
/100
|
#261
Tragic
19.4%
Immigrants | Guyana
0.1
/100
|
#262
Tragic
19.5%
Ottawa
0.1
/100
|
#263
Tragic
19.5%
Iroquois
0.1
/100
|
#264
Tragic
19.6%

Demographics Similar to Cajuns by Child Poverty Among Boys Under 16

In terms of child poverty among boys under 16, the demographic groups most similar to Cajuns are Immigrants from Dominica (22.2%, a difference of 0.020%), Honduran (22.3%, a difference of 0.56%), U.S. Virgin Islander (22.0%, a difference of 0.90%), Immigrants from Congo (22.4%, a difference of 0.93%), and Central American Indian (22.5%, a difference of 1.4%).
DemographicsRating | RankChild Poverty Among Boys Under 16
Ute
0.0
/100
|
#314
Tragic
21.6%
Immigrants | Somalia
0.0
/100
|
#315
Tragic
21.7%
Menominee
0.0
/100
|
#316
Tragic
21.7%
Africans
0.0
/100
|
#317
Tragic
21.7%
Yakama
0.0
/100
|
#318
Tragic
21.7%
Dutch West Indians
0.0
/100
|
#319
Tragic
21.8%
U.S. Virgin Islanders
0.0
/100
|
#320
Tragic
22.0%
Cajuns
0.0
/100
|
#321
Tragic
22.2%
Immigrants | Dominica
0.0
/100
|
#322
Tragic
22.2%
Hondurans
0.0
/100
|
#323
Tragic
22.3%
Immigrants | Congo
0.0
/100
|
#324
Tragic
22.4%
Central American Indians
0.0
/100
|
#325
Tragic
22.5%
Paiute
0.0
/100
|
#326
Tragic
22.8%
Immigrants | Honduras
0.0
/100
|
#327
Tragic
22.8%
Pueblo
0.0
/100
|
#328
Tragic
23.5%