Maltese vs Immigrants from North Macedonia In Labor Force | Age 35-44
COMPARE
Maltese
Immigrants from North Macedonia
In Labor Force | Age 35-44
In Labor Force | Age 35-44 Comparison
Maltese
Immigrants from North Macedonia
84.7%
IN LABOR FORCE | AGE 35-44
90.8/ 100
METRIC RATING
125th/ 347
METRIC RANK
85.6%
IN LABOR FORCE | AGE 35-44
100.0/ 100
METRIC RATING
17th/ 347
METRIC RANK
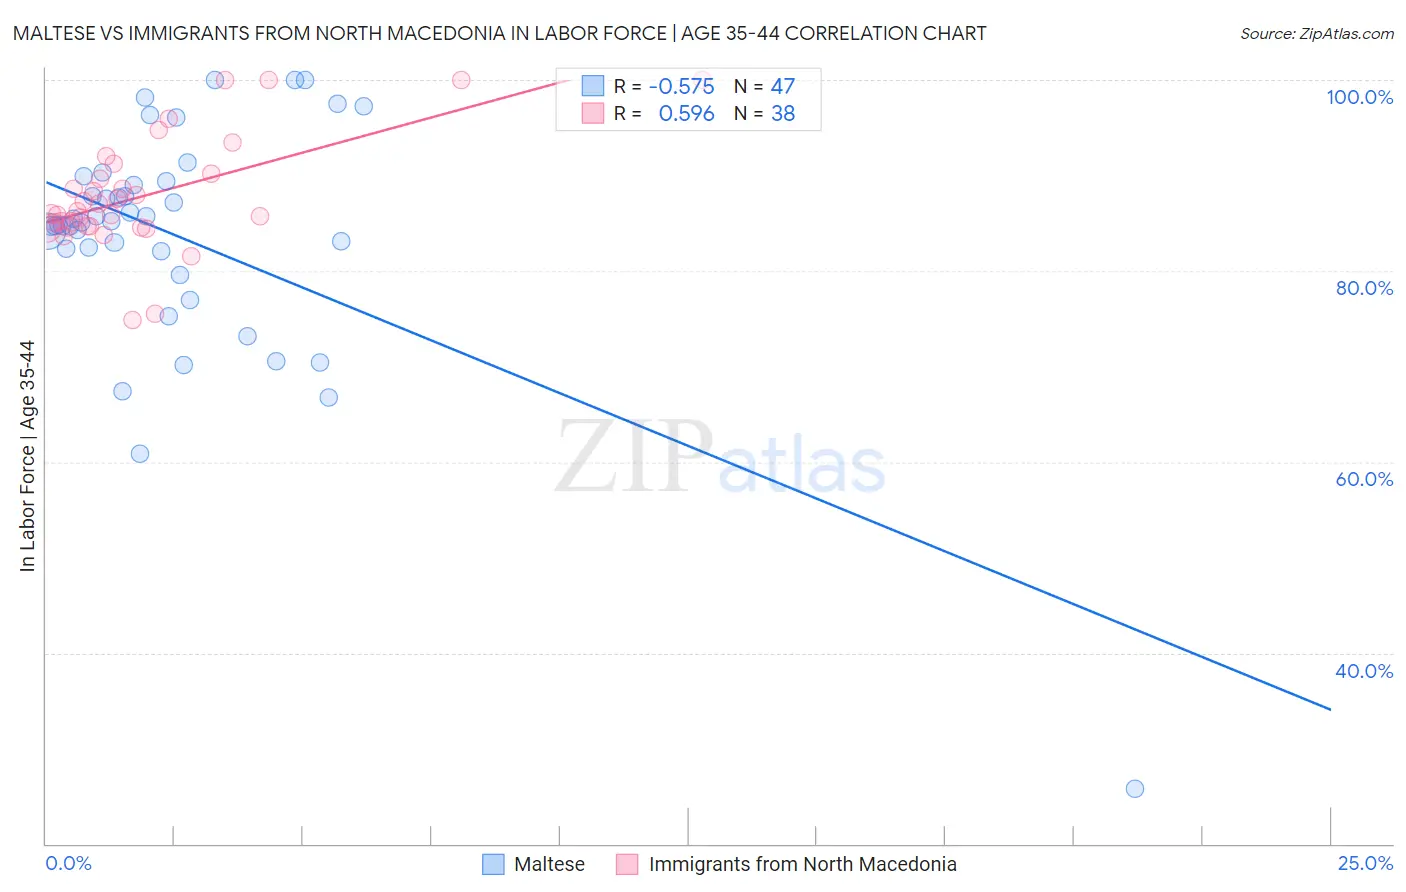
Maltese vs Immigrants from North Macedonia In Labor Force | Age 35-44 Correlation Chart
The statistical analysis conducted on geographies consisting of 126,440,103 people shows a substantial negative correlation between the proportion of Maltese and labor force participation rate among population between the ages 35 and 44 in the United States with a correlation coefficient (R) of -0.575 and weighted average of 84.7%. Similarly, the statistical analysis conducted on geographies consisting of 74,314,294 people shows a substantial positive correlation between the proportion of Immigrants from North Macedonia and labor force participation rate among population between the ages 35 and 44 in the United States with a correlation coefficient (R) of 0.596 and weighted average of 85.6%, a difference of 1.1%.
In Labor Force | Age 35-44 Correlation Summary
| Measurement | Maltese | Immigrants from North Macedonia |
| Minimum | 25.7% | 74.8% |
| Maximum | 100.0% | 100.0% |
| Range | 74.3% | 25.2% |
| Mean | 83.6% | 87.9% |
| Median | 85.1% | 86.1% |
| Interquartile 25% (IQ1) | 82.1% | 84.7% |
| Interquartile 75% (IQ3) | 89.4% | 90.2% |
| Interquartile Range (IQR) | 7.3% | 5.5% |
| Standard Deviation (Sample) | 12.5% | 5.9% |
| Standard Deviation (Population) | 12.4% | 5.8% |
Similar Demographics by In Labor Force | Age 35-44
Demographics Similar to Maltese by In Labor Force | Age 35-44
In terms of in labor force | age 35-44, the demographic groups most similar to Maltese are Immigrants from South America (84.7%, a difference of 0.0%), Slavic (84.7%, a difference of 0.0%), Asian (84.7%, a difference of 0.0%), Immigrants from Spain (84.7%, a difference of 0.0%), and Finnish (84.7%, a difference of 0.010%).
| Demographics | Rating | Rank | In Labor Force | Age 35-44 |
| Immigrants | Eastern Asia | 92.1 /100 | #118 | Exceptional 84.7% |
| Burmese | 91.8 /100 | #119 | Exceptional 84.7% |
| Immigrants | Northern Europe | 91.5 /100 | #120 | Exceptional 84.7% |
| Finns | 91.2 /100 | #121 | Exceptional 84.7% |
| Germans | 91.0 /100 | #122 | Exceptional 84.7% |
| Immigrants | South America | 90.9 /100 | #123 | Exceptional 84.7% |
| Slavs | 90.8 /100 | #124 | Exceptional 84.7% |
| Maltese | 90.8 /100 | #125 | Exceptional 84.7% |
| Asians | 90.6 /100 | #126 | Exceptional 84.7% |
| Immigrants | Spain | 90.6 /100 | #127 | Exceptional 84.7% |
| Immigrants | Ghana | 90.4 /100 | #128 | Exceptional 84.7% |
| Palestinians | 89.7 /100 | #129 | Excellent 84.7% |
| Bhutanese | 89.7 /100 | #130 | Excellent 84.7% |
| Immigrants | Scotland | 89.6 /100 | #131 | Excellent 84.7% |
| Austrians | 89.4 /100 | #132 | Excellent 84.7% |
Demographics Similar to Immigrants from North Macedonia by In Labor Force | Age 35-44
In terms of in labor force | age 35-44, the demographic groups most similar to Immigrants from North Macedonia are Carpatho Rusyn (85.6%, a difference of 0.0%), Slovene (85.6%, a difference of 0.0%), Norwegian (85.6%, a difference of 0.050%), Immigrants from Ireland (85.6%, a difference of 0.050%), and Immigrants from Serbia (85.5%, a difference of 0.050%).
| Demographics | Rating | Rank | In Labor Force | Age 35-44 |
| Cape Verdeans | 100.0 /100 | #10 | Exceptional 85.8% |
| Immigrants | Cameroon | 100.0 /100 | #11 | Exceptional 85.8% |
| Liberians | 100.0 /100 | #12 | Exceptional 85.7% |
| Somalis | 100.0 /100 | #13 | Exceptional 85.6% |
| Immigrants | Somalia | 100.0 /100 | #14 | Exceptional 85.6% |
| Norwegians | 100.0 /100 | #15 | Exceptional 85.6% |
| Immigrants | Ireland | 100.0 /100 | #16 | Exceptional 85.6% |
| Immigrants | North Macedonia | 100.0 /100 | #17 | Exceptional 85.6% |
| Carpatho Rusyns | 100.0 /100 | #18 | Exceptional 85.6% |
| Slovenes | 100.0 /100 | #19 | Exceptional 85.6% |
| Immigrants | Serbia | 100.0 /100 | #20 | Exceptional 85.5% |
| Bulgarians | 100.0 /100 | #21 | Exceptional 85.5% |
| Immigrants | Bosnia and Herzegovina | 100.0 /100 | #22 | Exceptional 85.4% |
| Immigrants | Eastern Africa | 100.0 /100 | #23 | Exceptional 85.4% |
| Latvians | 99.9 /100 | #24 | Exceptional 85.4% |