Immigrants from Australia vs Immigrants from North Macedonia Family Poverty
COMPARE
Immigrants from Australia
Immigrants from North Macedonia
Family Poverty
Family Poverty Comparison
Immigrants from Australia
Immigrants from North Macedonia
7.6%
FAMILY POVERTY
99.2/ 100
METRIC RATING
41st/ 347
METRIC RANK
7.7%
FAMILY POVERTY
98.9/ 100
METRIC RATING
50th/ 347
METRIC RANK
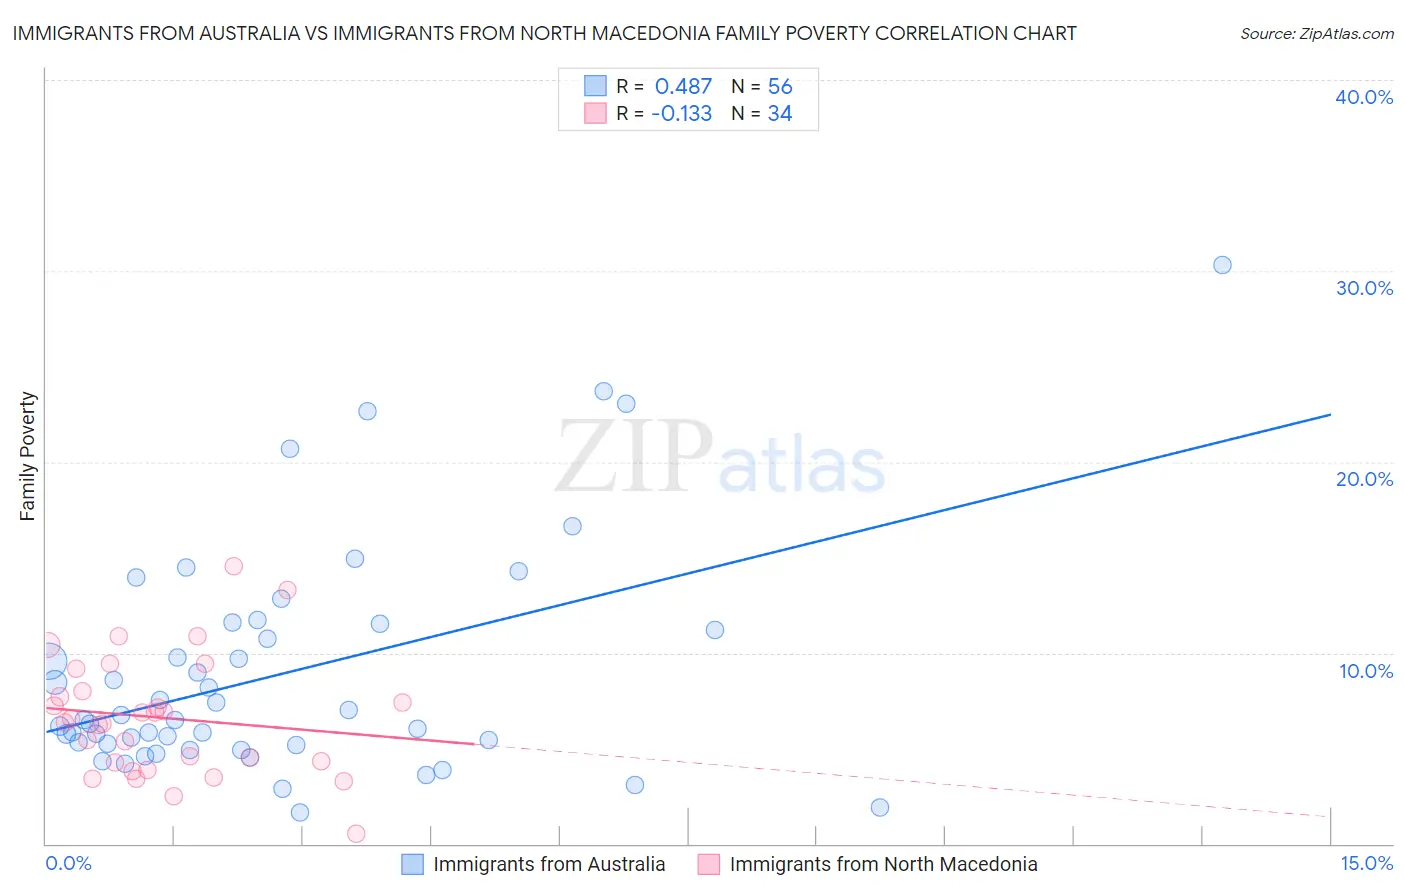
Immigrants from Australia vs Immigrants from North Macedonia Family Poverty Correlation Chart
The statistical analysis conducted on geographies consisting of 226,808,313 people shows a moderate positive correlation between the proportion of Immigrants from Australia and poverty level among families in the United States with a correlation coefficient (R) of 0.487 and weighted average of 7.6%. Similarly, the statistical analysis conducted on geographies consisting of 74,220,481 people shows a poor negative correlation between the proportion of Immigrants from North Macedonia and poverty level among families in the United States with a correlation coefficient (R) of -0.133 and weighted average of 7.7%, a difference of 1.5%.
Family Poverty Correlation Summary
| Measurement | Immigrants from Australia | Immigrants from North Macedonia |
| Minimum | 1.7% | 0.51% |
| Maximum | 30.3% | 14.6% |
| Range | 28.6% | 14.0% |
| Mean | 8.9% | 6.6% |
| Median | 6.5% | 6.4% |
| Interquartile 25% (IQ1) | 5.2% | 4.3% |
| Interquartile 75% (IQ3) | 11.4% | 8.0% |
| Interquartile Range (IQR) | 6.2% | 3.7% |
| Standard Deviation (Sample) | 6.0% | 3.1% |
| Standard Deviation (Population) | 5.9% | 3.1% |
Demographics Similar to Immigrants from Australia and Immigrants from North Macedonia by Family Poverty
In terms of family poverty, the demographic groups most similar to Immigrants from Australia are Slovene (7.5%, a difference of 0.30%), Carpatho Rusyn (7.5%, a difference of 0.34%), Bolivian (7.5%, a difference of 0.40%), Scandinavian (7.6%, a difference of 0.63%), and Estonian (7.5%, a difference of 0.64%). Similarly, the demographic groups most similar to Immigrants from North Macedonia are Immigrants from Bolivia (7.7%, a difference of 0.030%), Immigrants from Moldova (7.7%, a difference of 0.15%), Immigrants from Sri Lanka (7.7%, a difference of 0.22%), Immigrants from Czechoslovakia (7.7%, a difference of 0.23%), and Tongan (7.7%, a difference of 0.25%).
| Demographics | Rating | Rank | Family Poverty |
| Greeks | 99.4 /100 | #35 | Exceptional 7.5% |
| Turks | 99.4 /100 | #36 | Exceptional 7.5% |
| Estonians | 99.4 /100 | #37 | Exceptional 7.5% |
| Bolivians | 99.3 /100 | #38 | Exceptional 7.5% |
| Carpatho Rusyns | 99.3 /100 | #39 | Exceptional 7.5% |
| Slovenes | 99.3 /100 | #40 | Exceptional 7.5% |
| Immigrants | Australia | 99.2 /100 | #41 | Exceptional 7.6% |
| Scandinavians | 99.1 /100 | #42 | Exceptional 7.6% |
| Immigrants | Austria | 99.1 /100 | #43 | Exceptional 7.6% |
| Germans | 99.0 /100 | #44 | Exceptional 7.7% |
| Okinawans | 98.9 /100 | #45 | Exceptional 7.7% |
| Tongans | 98.9 /100 | #46 | Exceptional 7.7% |
| Immigrants | Czechoslovakia | 98.9 /100 | #47 | Exceptional 7.7% |
| Immigrants | Sri Lanka | 98.9 /100 | #48 | Exceptional 7.7% |
| Immigrants | Bolivia | 98.9 /100 | #49 | Exceptional 7.7% |
| Immigrants | North Macedonia | 98.9 /100 | #50 | Exceptional 7.7% |
| Immigrants | Moldova | 98.8 /100 | #51 | Exceptional 7.7% |
| Indians (Asian) | 98.8 /100 | #52 | Exceptional 7.7% |
| Swiss | 98.8 /100 | #53 | Exceptional 7.7% |
| Immigrants | Sweden | 98.8 /100 | #54 | Exceptional 7.7% |
| Immigrants | Eastern Asia | 98.7 /100 | #55 | Exceptional 7.7% |