Maltese vs Immigrants from Austria Receiving Food Stamps
COMPARE
Maltese
Immigrants from Austria
Receiving Food Stamps
Receiving Food Stamps Comparison
Maltese
Immigrants from Austria
8.9%
RECEIVING FOOD STAMPS
99.9/ 100
METRIC RATING
14th/ 347
METRIC RANK
9.5%
RECEIVING FOOD STAMPS
99.6/ 100
METRIC RATING
35th/ 347
METRIC RANK
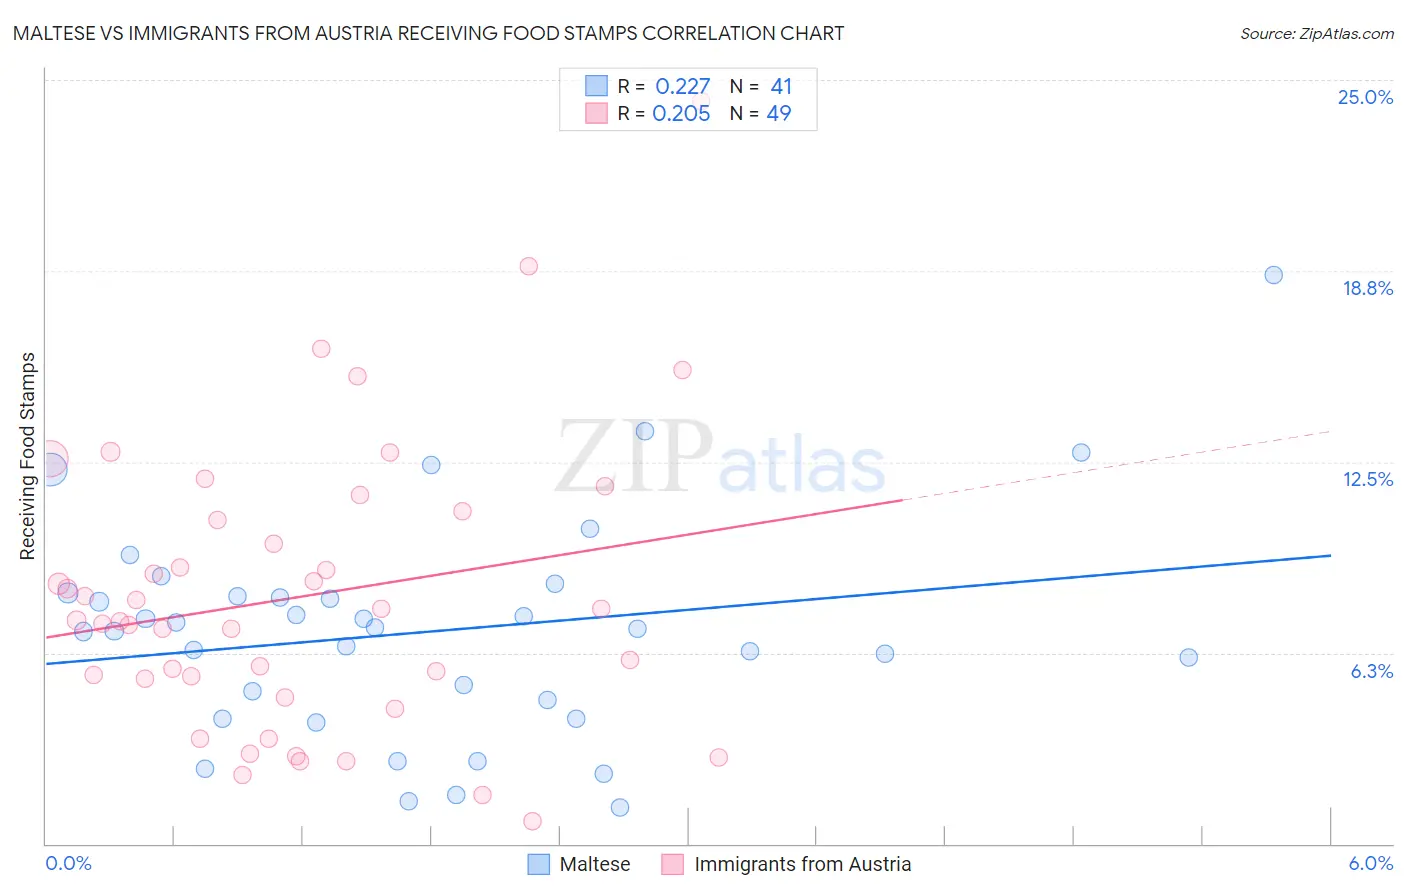
Maltese vs Immigrants from Austria Receiving Food Stamps Correlation Chart
The statistical analysis conducted on geographies consisting of 126,326,632 people shows a weak positive correlation between the proportion of Maltese and percentage of population receiving government assistance and/or food stamps in the United States with a correlation coefficient (R) of 0.227 and weighted average of 8.9%. Similarly, the statistical analysis conducted on geographies consisting of 167,584,591 people shows a weak positive correlation between the proportion of Immigrants from Austria and percentage of population receiving government assistance and/or food stamps in the United States with a correlation coefficient (R) of 0.205 and weighted average of 9.5%, a difference of 6.6%.
Receiving Food Stamps Correlation Summary
| Measurement | Maltese | Immigrants from Austria |
| Minimum | 1.2% | 0.74% |
| Maximum | 18.6% | 24.3% |
| Range | 17.4% | 23.6% |
| Mean | 6.9% | 8.1% |
| Median | 7.0% | 7.3% |
| Interquartile 25% (IQ1) | 4.4% | 5.1% |
| Interquartile 75% (IQ3) | 8.2% | 10.7% |
| Interquartile Range (IQR) | 3.8% | 5.6% |
| Standard Deviation (Sample) | 3.6% | 4.7% |
| Standard Deviation (Population) | 3.5% | 4.7% |
Similar Demographics by Receiving Food Stamps
Demographics Similar to Maltese by Receiving Food Stamps
In terms of receiving food stamps, the demographic groups most similar to Maltese are Bulgarian (8.9%, a difference of 0.13%), Okinawan (8.9%, a difference of 0.33%), Cypriot (8.9%, a difference of 0.33%), Norwegian (9.0%, a difference of 0.66%), and Immigrants from South Central Asia (8.8%, a difference of 0.77%).
| Demographics | Rating | Rank | Receiving Food Stamps |
| Immigrants | Iran | 100.0 /100 | #7 | Exceptional 8.3% |
| Burmese | 99.9 /100 | #8 | Exceptional 8.6% |
| Immigrants | Korea | 99.9 /100 | #9 | Exceptional 8.7% |
| Immigrants | South Central Asia | 99.9 /100 | #10 | Exceptional 8.8% |
| Okinawans | 99.9 /100 | #11 | Exceptional 8.9% |
| Cypriots | 99.9 /100 | #12 | Exceptional 8.9% |
| Bulgarians | 99.9 /100 | #13 | Exceptional 8.9% |
| Maltese | 99.9 /100 | #14 | Exceptional 8.9% |
| Norwegians | 99.9 /100 | #15 | Exceptional 9.0% |
| Immigrants | Japan | 99.9 /100 | #16 | Exceptional 9.0% |
| Immigrants | Scotland | 99.9 /100 | #17 | Exceptional 9.0% |
| Danes | 99.9 /100 | #18 | Exceptional 9.0% |
| Immigrants | Hong Kong | 99.8 /100 | #19 | Exceptional 9.1% |
| Latvians | 99.8 /100 | #20 | Exceptional 9.1% |
| Luxembourgers | 99.8 /100 | #21 | Exceptional 9.1% |
Demographics Similar to Immigrants from Austria by Receiving Food Stamps
In terms of receiving food stamps, the demographic groups most similar to Immigrants from Austria are Estonian (9.5%, a difference of 0.020%), Turkish (9.5%, a difference of 0.030%), Zimbabwean (9.5%, a difference of 0.050%), European (9.5%, a difference of 0.090%), and Immigrants from Sri Lanka (9.5%, a difference of 0.38%).
| Demographics | Rating | Rank | Receiving Food Stamps |
| Czechs | 99.8 /100 | #28 | Exceptional 9.2% |
| Immigrants | Lithuania | 99.8 /100 | #29 | Exceptional 9.2% |
| Immigrants | Sweden | 99.7 /100 | #30 | Exceptional 9.3% |
| Immigrants | Eastern Asia | 99.7 /100 | #31 | Exceptional 9.3% |
| Bolivians | 99.7 /100 | #32 | Exceptional 9.3% |
| Zimbabweans | 99.6 /100 | #33 | Exceptional 9.5% |
| Turks | 99.6 /100 | #34 | Exceptional 9.5% |
| Immigrants | Austria | 99.6 /100 | #35 | Exceptional 9.5% |
| Estonians | 99.6 /100 | #36 | Exceptional 9.5% |
| Europeans | 99.6 /100 | #37 | Exceptional 9.5% |
| Immigrants | Sri Lanka | 99.5 /100 | #38 | Exceptional 9.5% |
| Immigrants | Bolivia | 99.5 /100 | #39 | Exceptional 9.5% |
| Immigrants | Netherlands | 99.5 /100 | #40 | Exceptional 9.5% |
| Cambodians | 99.5 /100 | #41 | Exceptional 9.5% |
| Immigrants | China | 99.5 /100 | #42 | Exceptional 9.6% |