Maltese vs Yaqui Receiving Food Stamps
COMPARE
Maltese
Yaqui
Receiving Food Stamps
Receiving Food Stamps Comparison
Maltese
Yaqui
8.9%
RECEIVING FOOD STAMPS
99.9/ 100
METRIC RATING
14th/ 347
METRIC RANK
13.9%
RECEIVING FOOD STAMPS
0.5/ 100
METRIC RATING
251st/ 347
METRIC RANK
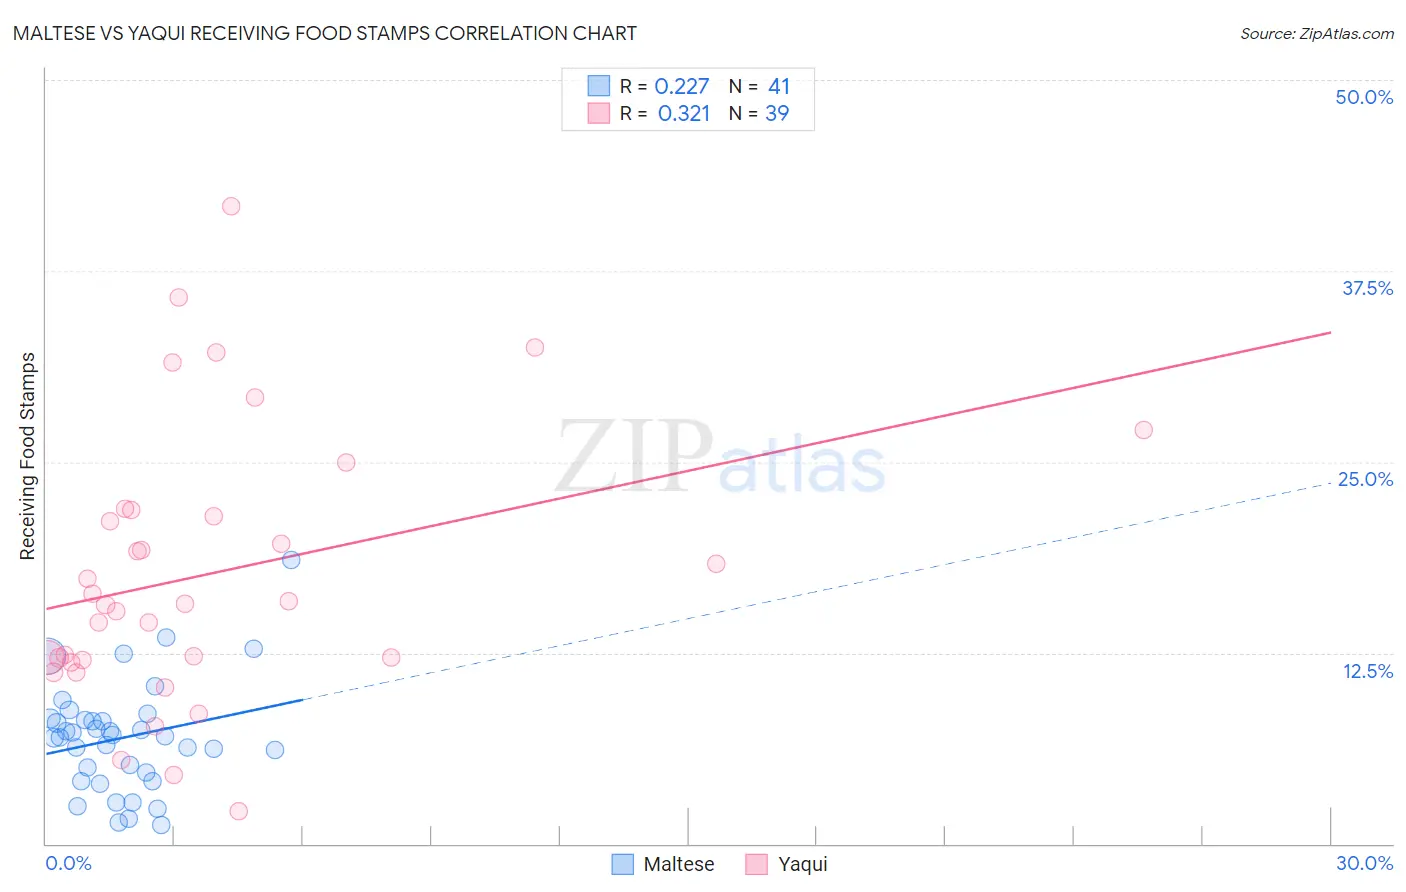
Maltese vs Yaqui Receiving Food Stamps Correlation Chart
The statistical analysis conducted on geographies consisting of 126,326,632 people shows a weak positive correlation between the proportion of Maltese and percentage of population receiving government assistance and/or food stamps in the United States with a correlation coefficient (R) of 0.227 and weighted average of 8.9%. Similarly, the statistical analysis conducted on geographies consisting of 107,632,766 people shows a mild positive correlation between the proportion of Yaqui and percentage of population receiving government assistance and/or food stamps in the United States with a correlation coefficient (R) of 0.321 and weighted average of 13.9%, a difference of 56.1%.
Receiving Food Stamps Correlation Summary
| Measurement | Maltese | Yaqui |
| Minimum | 1.2% | 2.1% |
| Maximum | 18.6% | 41.8% |
| Range | 17.4% | 39.7% |
| Mean | 6.9% | 17.7% |
| Median | 7.0% | 15.7% |
| Interquartile 25% (IQ1) | 4.4% | 12.0% |
| Interquartile 75% (IQ3) | 8.2% | 21.8% |
| Interquartile Range (IQR) | 3.8% | 9.8% |
| Standard Deviation (Sample) | 3.6% | 8.9% |
| Standard Deviation (Population) | 3.5% | 8.8% |
Similar Demographics by Receiving Food Stamps
Demographics Similar to Maltese by Receiving Food Stamps
In terms of receiving food stamps, the demographic groups most similar to Maltese are Bulgarian (8.9%, a difference of 0.13%), Okinawan (8.9%, a difference of 0.33%), Cypriot (8.9%, a difference of 0.33%), Norwegian (9.0%, a difference of 0.66%), and Immigrants from South Central Asia (8.8%, a difference of 0.77%).
| Demographics | Rating | Rank | Receiving Food Stamps |
| Immigrants | Iran | 100.0 /100 | #7 | Exceptional 8.3% |
| Burmese | 99.9 /100 | #8 | Exceptional 8.6% |
| Immigrants | Korea | 99.9 /100 | #9 | Exceptional 8.7% |
| Immigrants | South Central Asia | 99.9 /100 | #10 | Exceptional 8.8% |
| Okinawans | 99.9 /100 | #11 | Exceptional 8.9% |
| Cypriots | 99.9 /100 | #12 | Exceptional 8.9% |
| Bulgarians | 99.9 /100 | #13 | Exceptional 8.9% |
| Maltese | 99.9 /100 | #14 | Exceptional 8.9% |
| Norwegians | 99.9 /100 | #15 | Exceptional 9.0% |
| Immigrants | Japan | 99.9 /100 | #16 | Exceptional 9.0% |
| Immigrants | Scotland | 99.9 /100 | #17 | Exceptional 9.0% |
| Danes | 99.9 /100 | #18 | Exceptional 9.0% |
| Immigrants | Hong Kong | 99.8 /100 | #19 | Exceptional 9.1% |
| Latvians | 99.8 /100 | #20 | Exceptional 9.1% |
| Luxembourgers | 99.8 /100 | #21 | Exceptional 9.1% |
Demographics Similar to Yaqui by Receiving Food Stamps
In terms of receiving food stamps, the demographic groups most similar to Yaqui are Immigrants from Cambodia (13.9%, a difference of 0.070%), Indonesian (13.9%, a difference of 0.24%), Ghanaian (14.0%, a difference of 0.44%), Spanish American (14.0%, a difference of 0.82%), and Immigrants from Laos (13.8%, a difference of 0.88%).
| Demographics | Rating | Rank | Receiving Food Stamps |
| Cajuns | 0.9 /100 | #244 | Tragic 13.7% |
| Immigrants | Somalia | 0.9 /100 | #245 | Tragic 13.7% |
| Cree | 0.8 /100 | #246 | Tragic 13.7% |
| Mexican American Indians | 0.7 /100 | #247 | Tragic 13.8% |
| Immigrants | Laos | 0.7 /100 | #248 | Tragic 13.8% |
| Indonesians | 0.6 /100 | #249 | Tragic 13.9% |
| Immigrants | Cambodia | 0.5 /100 | #250 | Tragic 13.9% |
| Yaqui | 0.5 /100 | #251 | Tragic 13.9% |
| Ghanaians | 0.5 /100 | #252 | Tragic 14.0% |
| Spanish Americans | 0.4 /100 | #253 | Tragic 14.0% |
| Marshallese | 0.3 /100 | #254 | Tragic 14.1% |
| Sub-Saharan Africans | 0.3 /100 | #255 | Tragic 14.1% |
| Japanese | 0.3 /100 | #256 | Tragic 14.1% |
| Arapaho | 0.3 /100 | #257 | Tragic 14.1% |
| Immigrants | Ghana | 0.3 /100 | #258 | Tragic 14.1% |