Immigrants from Greece vs Immigrants from Austria Receiving Food Stamps
COMPARE
Immigrants from Greece
Immigrants from Austria
Receiving Food Stamps
Receiving Food Stamps Comparison
Immigrants from Greece
Immigrants from Austria
10.3%
RECEIVING FOOD STAMPS
97.4/ 100
METRIC RATING
94th/ 347
METRIC RANK
9.5%
RECEIVING FOOD STAMPS
99.6/ 100
METRIC RATING
35th/ 347
METRIC RANK
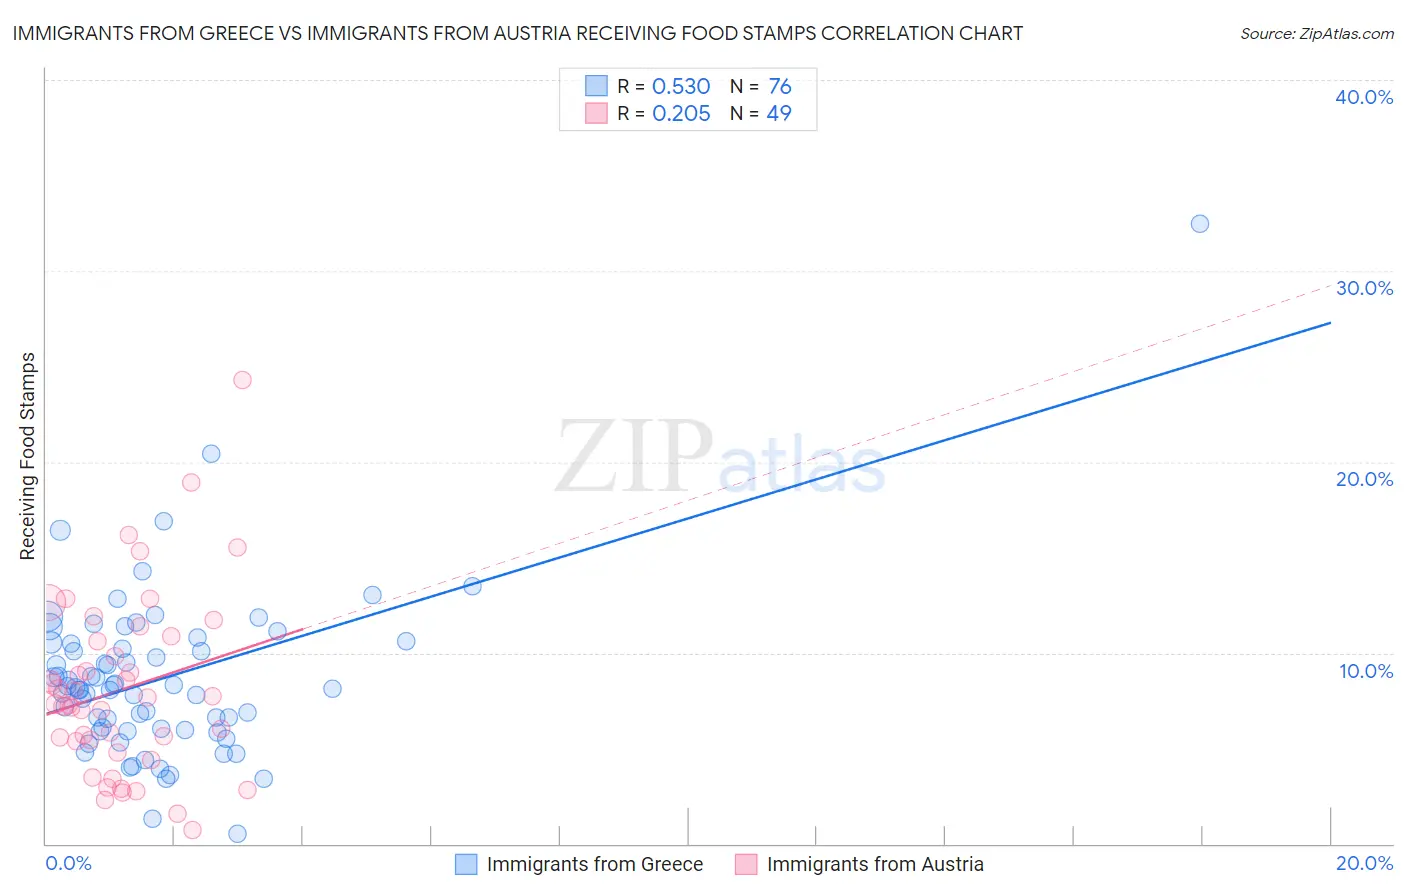
Immigrants from Greece vs Immigrants from Austria Receiving Food Stamps Correlation Chart
The statistical analysis conducted on geographies consisting of 216,550,316 people shows a substantial positive correlation between the proportion of Immigrants from Greece and percentage of population receiving government assistance and/or food stamps in the United States with a correlation coefficient (R) of 0.530 and weighted average of 10.3%. Similarly, the statistical analysis conducted on geographies consisting of 167,584,591 people shows a weak positive correlation between the proportion of Immigrants from Austria and percentage of population receiving government assistance and/or food stamps in the United States with a correlation coefficient (R) of 0.205 and weighted average of 9.5%, a difference of 8.1%.
Receiving Food Stamps Correlation Summary
| Measurement | Immigrants from Greece | Immigrants from Austria |
| Minimum | 0.50% | 0.74% |
| Maximum | 32.5% | 24.3% |
| Range | 32.0% | 23.6% |
| Mean | 8.6% | 8.1% |
| Median | 8.2% | 7.3% |
| Interquartile 25% (IQ1) | 6.0% | 5.1% |
| Interquartile 75% (IQ3) | 10.5% | 10.7% |
| Interquartile Range (IQR) | 4.5% | 5.6% |
| Standard Deviation (Sample) | 4.4% | 4.7% |
| Standard Deviation (Population) | 4.4% | 4.7% |
Similar Demographics by Receiving Food Stamps
Demographics Similar to Immigrants from Greece by Receiving Food Stamps
In terms of receiving food stamps, the demographic groups most similar to Immigrants from Greece are Basque (10.3%, a difference of 0.030%), Welsh (10.3%, a difference of 0.080%), Czechoslovakian (10.3%, a difference of 0.34%), Immigrants from Egypt (10.3%, a difference of 0.39%), and Belgian (10.2%, a difference of 0.53%).
| Demographics | Rating | Rank | Receiving Food Stamps |
| Egyptians | 98.4 /100 | #87 | Exceptional 10.0% |
| Immigrants | Kuwait | 98.4 /100 | #88 | Exceptional 10.0% |
| Immigrants | France | 98.3 /100 | #89 | Exceptional 10.1% |
| Finns | 97.9 /100 | #90 | Exceptional 10.2% |
| Jordanians | 97.9 /100 | #91 | Exceptional 10.2% |
| Irish | 97.9 /100 | #92 | Exceptional 10.2% |
| Belgians | 97.7 /100 | #93 | Exceptional 10.2% |
| Immigrants | Greece | 97.4 /100 | #94 | Exceptional 10.3% |
| Basques | 97.4 /100 | #95 | Exceptional 10.3% |
| Welsh | 97.3 /100 | #96 | Exceptional 10.3% |
| Czechoslovakians | 97.2 /100 | #97 | Exceptional 10.3% |
| Immigrants | Egypt | 97.1 /100 | #98 | Exceptional 10.3% |
| Serbians | 97.0 /100 | #99 | Exceptional 10.3% |
| Immigrants | Western Europe | 96.9 /100 | #100 | Exceptional 10.3% |
| Palestinians | 96.9 /100 | #101 | Exceptional 10.3% |
Demographics Similar to Immigrants from Austria by Receiving Food Stamps
In terms of receiving food stamps, the demographic groups most similar to Immigrants from Austria are Estonian (9.5%, a difference of 0.020%), Turkish (9.5%, a difference of 0.030%), Zimbabwean (9.5%, a difference of 0.050%), European (9.5%, a difference of 0.090%), and Immigrants from Sri Lanka (9.5%, a difference of 0.38%).
| Demographics | Rating | Rank | Receiving Food Stamps |
| Czechs | 99.8 /100 | #28 | Exceptional 9.2% |
| Immigrants | Lithuania | 99.8 /100 | #29 | Exceptional 9.2% |
| Immigrants | Sweden | 99.7 /100 | #30 | Exceptional 9.3% |
| Immigrants | Eastern Asia | 99.7 /100 | #31 | Exceptional 9.3% |
| Bolivians | 99.7 /100 | #32 | Exceptional 9.3% |
| Zimbabweans | 99.6 /100 | #33 | Exceptional 9.5% |
| Turks | 99.6 /100 | #34 | Exceptional 9.5% |
| Immigrants | Austria | 99.6 /100 | #35 | Exceptional 9.5% |
| Estonians | 99.6 /100 | #36 | Exceptional 9.5% |
| Europeans | 99.6 /100 | #37 | Exceptional 9.5% |
| Immigrants | Sri Lanka | 99.5 /100 | #38 | Exceptional 9.5% |
| Immigrants | Bolivia | 99.5 /100 | #39 | Exceptional 9.5% |
| Immigrants | Netherlands | 99.5 /100 | #40 | Exceptional 9.5% |
| Cambodians | 99.5 /100 | #41 | Exceptional 9.5% |
| Immigrants | China | 99.5 /100 | #42 | Exceptional 9.6% |