Cherokee vs Cape Verdean Seniors Poverty Over the Age of 65
COMPARE
Cherokee
Cape Verdean
Seniors Poverty Over the Age of 65
Seniors Poverty Over the Age of 65 Comparison
Cherokee
Cape Verdeans
11.0%
SENIORS POVERTY OVER THE AGE OF 65
47.3/ 100
METRIC RATING
177th/ 347
METRIC RANK
14.7%
SENIORS POVERTY OVER THE AGE OF 65
0.0/ 100
METRIC RATING
319th/ 347
METRIC RANK
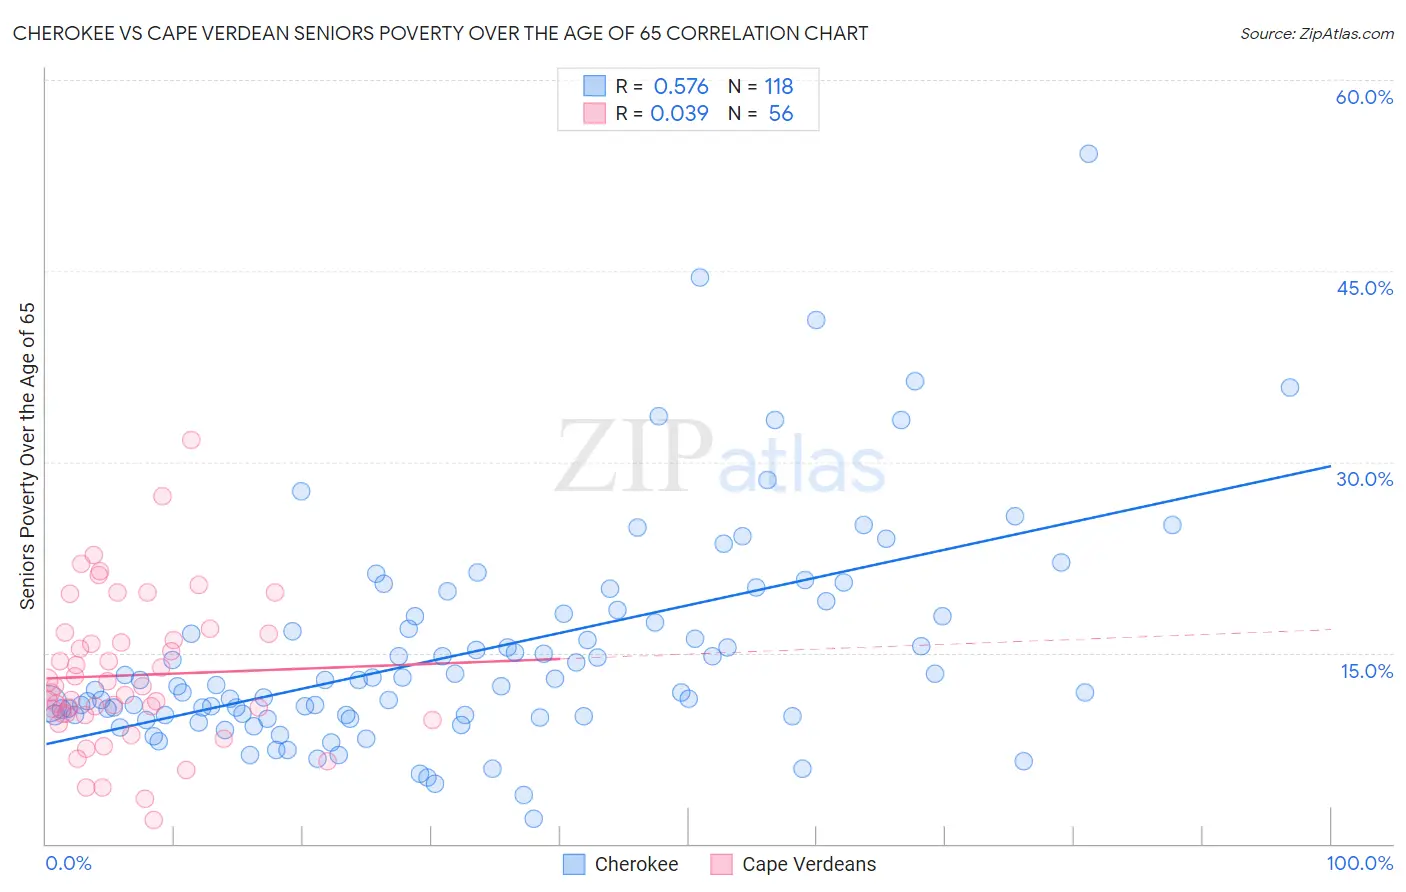
Cherokee vs Cape Verdean Seniors Poverty Over the Age of 65 Correlation Chart
The statistical analysis conducted on geographies consisting of 491,058,144 people shows a substantial positive correlation between the proportion of Cherokee and poverty level among seniors over the age of 65 in the United States with a correlation coefficient (R) of 0.576 and weighted average of 11.0%. Similarly, the statistical analysis conducted on geographies consisting of 107,426,458 people shows no correlation between the proportion of Cape Verdeans and poverty level among seniors over the age of 65 in the United States with a correlation coefficient (R) of 0.039 and weighted average of 14.7%, a difference of 33.8%.
Seniors Poverty Over the Age of 65 Correlation Summary
| Measurement | Cherokee | Cape Verdean |
| Minimum | 2.0% | 1.9% |
| Maximum | 54.2% | 31.7% |
| Range | 52.2% | 29.9% |
| Mean | 15.1% | 13.2% |
| Median | 12.4% | 12.1% |
| Interquartile 25% (IQ1) | 10.1% | 10.2% |
| Interquartile 75% (IQ3) | 17.9% | 16.2% |
| Interquartile Range (IQR) | 7.8% | 6.1% |
| Standard Deviation (Sample) | 8.6% | 5.8% |
| Standard Deviation (Population) | 8.5% | 5.8% |
Similar Demographics by Seniors Poverty Over the Age of 65
Demographics Similar to Cherokee by Seniors Poverty Over the Age of 65
In terms of seniors poverty over the age of 65, the demographic groups most similar to Cherokee are German Russian (11.0%, a difference of 0.040%), Immigrants from Malaysia (11.0%, a difference of 0.050%), Creek (10.9%, a difference of 0.20%), Immigrants from Sudan (10.9%, a difference of 0.24%), and Immigrants from Northern Africa (11.0%, a difference of 0.25%).
| Demographics | Rating | Rank | Seniors Poverty Over the Age of 65 |
| Immigrants | Eastern Europe | 55.8 /100 | #170 | Average 10.9% |
| Immigrants | Nonimmigrants | 55.1 /100 | #171 | Average 10.9% |
| Immigrants | Syria | 54.7 /100 | #172 | Average 10.9% |
| Spaniards | 50.7 /100 | #173 | Average 10.9% |
| Immigrants | Sudan | 50.0 /100 | #174 | Average 10.9% |
| Creek | 49.6 /100 | #175 | Average 10.9% |
| Immigrants | Malaysia | 47.9 /100 | #176 | Average 11.0% |
| Cherokee | 47.3 /100 | #177 | Average 11.0% |
| German Russians | 46.9 /100 | #178 | Average 11.0% |
| Immigrants | Northern Africa | 44.6 /100 | #179 | Average 11.0% |
| Immigrants | Thailand | 43.5 /100 | #180 | Average 11.0% |
| Immigrants | Eastern Africa | 43.4 /100 | #181 | Average 11.0% |
| Immigrants | Fiji | 42.0 /100 | #182 | Average 11.0% |
| Immigrants | Kazakhstan | 41.0 /100 | #183 | Average 11.0% |
| Immigrants | France | 40.9 /100 | #184 | Average 11.0% |
Demographics Similar to Cape Verdeans by Seniors Poverty Over the Age of 65
In terms of seniors poverty over the age of 65, the demographic groups most similar to Cape Verdeans are Immigrants from Haiti (14.7%, a difference of 0.18%), Houma (14.7%, a difference of 0.39%), Immigrants from Barbados (14.8%, a difference of 0.78%), Yakama (14.8%, a difference of 0.93%), and Immigrants from Honduras (14.5%, a difference of 1.2%).
| Demographics | Rating | Rank | Seniors Poverty Over the Age of 65 |
| Hispanics or Latinos | 0.0 /100 | #312 | Tragic 14.3% |
| Barbadians | 0.0 /100 | #313 | Tragic 14.4% |
| Guyanese | 0.0 /100 | #314 | Tragic 14.4% |
| Immigrants | Ecuador | 0.0 /100 | #315 | Tragic 14.4% |
| Immigrants | Guyana | 0.0 /100 | #316 | Tragic 14.5% |
| Haitians | 0.0 /100 | #317 | Tragic 14.5% |
| Immigrants | Honduras | 0.0 /100 | #318 | Tragic 14.5% |
| Cape Verdeans | 0.0 /100 | #319 | Tragic 14.7% |
| Immigrants | Haiti | 0.0 /100 | #320 | Tragic 14.7% |
| Houma | 0.0 /100 | #321 | Tragic 14.7% |
| Immigrants | Barbados | 0.0 /100 | #322 | Tragic 14.8% |
| Yakama | 0.0 /100 | #323 | Tragic 14.8% |
| Nicaraguans | 0.0 /100 | #324 | Tragic 15.0% |
| Central American Indians | 0.0 /100 | #325 | Tragic 15.1% |
| Immigrants | Armenia | 0.0 /100 | #326 | Tragic 15.2% |