Malaysian vs Immigrants from Israel Female Poverty Among 25-34 Year Olds
COMPARE
Malaysian
Immigrants from Israel
Female Poverty Among 25-34 Year Olds
Female Poverty Among 25-34 Year Olds Comparison
Malaysians
Immigrants from Israel
14.7%
FEMALE POVERTY AMONG 25-34 YEAR OLDS
1.4/ 100
METRIC RATING
239th/ 347
METRIC RANK
12.0%
FEMALE POVERTY AMONG 25-34 YEAR OLDS
99.6/ 100
METRIC RATING
53rd/ 347
METRIC RANK
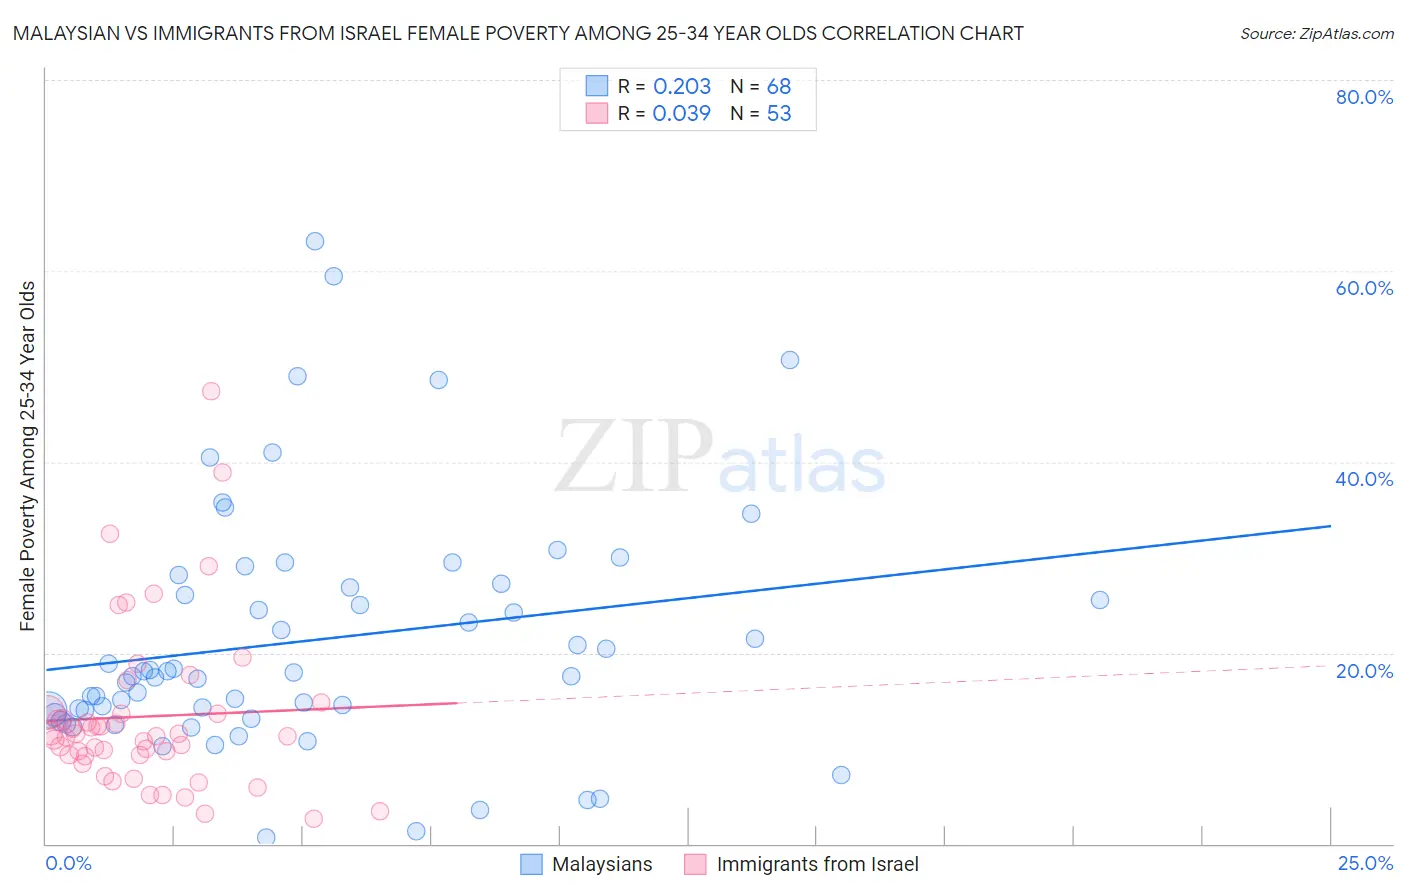
Malaysian vs Immigrants from Israel Female Poverty Among 25-34 Year Olds Correlation Chart
The statistical analysis conducted on geographies consisting of 224,654,876 people shows a weak positive correlation between the proportion of Malaysians and poverty level among females between the ages 25 and 34 in the United States with a correlation coefficient (R) of 0.203 and weighted average of 14.7%. Similarly, the statistical analysis conducted on geographies consisting of 207,529,391 people shows no correlation between the proportion of Immigrants from Israel and poverty level among females between the ages 25 and 34 in the United States with a correlation coefficient (R) of 0.039 and weighted average of 12.0%, a difference of 22.9%.
Female Poverty Among 25-34 Year Olds Correlation Summary
| Measurement | Malaysian | Immigrants from Israel |
| Minimum | 0.70% | 2.6% |
| Maximum | 63.1% | 47.5% |
| Range | 62.4% | 44.8% |
| Mean | 21.3% | 13.3% |
| Median | 17.8% | 11.2% |
| Interquartile 25% (IQ1) | 13.7% | 9.2% |
| Interquartile 75% (IQ3) | 27.1% | 13.7% |
| Interquartile Range (IQR) | 13.3% | 4.5% |
| Standard Deviation (Sample) | 12.8% | 8.7% |
| Standard Deviation (Population) | 12.7% | 8.6% |
Similar Demographics by Female Poverty Among 25-34 Year Olds
Demographics Similar to Malaysians by Female Poverty Among 25-34 Year Olds
In terms of female poverty among 25-34 year olds, the demographic groups most similar to Malaysians are Alsatian (14.7%, a difference of 0.030%), Immigrants from Grenada (14.7%, a difference of 0.050%), Salvadoran (14.7%, a difference of 0.070%), Immigrants from Ghana (14.7%, a difference of 0.070%), and Immigrants from Jamaica (14.7%, a difference of 0.090%).
| Demographics | Rating | Rank | Female Poverty Among 25-34 Year Olds |
| Immigrants | Ecuador | 1.9 /100 | #232 | Tragic 14.6% |
| Whites/Caucasians | 1.8 /100 | #233 | Tragic 14.7% |
| Cubans | 1.6 /100 | #234 | Tragic 14.7% |
| Immigrants | Jamaica | 1.4 /100 | #235 | Tragic 14.7% |
| Salvadorans | 1.4 /100 | #236 | Tragic 14.7% |
| Immigrants | Ghana | 1.4 /100 | #237 | Tragic 14.7% |
| Alsatians | 1.4 /100 | #238 | Tragic 14.7% |
| Malaysians | 1.4 /100 | #239 | Tragic 14.7% |
| Immigrants | Grenada | 1.3 /100 | #240 | Tragic 14.7% |
| Scotch-Irish | 1.2 /100 | #241 | Tragic 14.8% |
| Barbadians | 1.2 /100 | #242 | Tragic 14.8% |
| Immigrants | Nicaragua | 1.1 /100 | #243 | Tragic 14.8% |
| Immigrants | Bangladesh | 1.1 /100 | #244 | Tragic 14.8% |
| Immigrants | Middle Africa | 1.0 /100 | #245 | Tragic 14.8% |
| Jamaicans | 1.0 /100 | #246 | Tragic 14.8% |
Demographics Similar to Immigrants from Israel by Female Poverty Among 25-34 Year Olds
In terms of female poverty among 25-34 year olds, the demographic groups most similar to Immigrants from Israel are Immigrants from Eastern Europe (12.0%, a difference of 0.12%), Eastern European (12.0%, a difference of 0.12%), Paraguayan (12.0%, a difference of 0.14%), Immigrants from Croatia (12.0%, a difference of 0.15%), and Immigrants from Egypt (12.0%, a difference of 0.16%).
| Demographics | Rating | Rank | Female Poverty Among 25-34 Year Olds |
| Immigrants | Serbia | 99.7 /100 | #46 | Exceptional 11.9% |
| Koreans | 99.6 /100 | #47 | Exceptional 12.0% |
| Immigrants | Belarus | 99.6 /100 | #48 | Exceptional 12.0% |
| Immigrants | Egypt | 99.6 /100 | #49 | Exceptional 12.0% |
| Immigrants | Croatia | 99.6 /100 | #50 | Exceptional 12.0% |
| Paraguayans | 99.6 /100 | #51 | Exceptional 12.0% |
| Immigrants | Eastern Europe | 99.6 /100 | #52 | Exceptional 12.0% |
| Immigrants | Israel | 99.6 /100 | #53 | Exceptional 12.0% |
| Eastern Europeans | 99.6 /100 | #54 | Exceptional 12.0% |
| Immigrants | Philippines | 99.5 /100 | #55 | Exceptional 12.0% |
| Luxembourgers | 99.5 /100 | #56 | Exceptional 12.1% |
| Jordanians | 99.4 /100 | #57 | Exceptional 12.1% |
| Immigrants | Romania | 99.4 /100 | #58 | Exceptional 12.1% |
| Russians | 99.4 /100 | #59 | Exceptional 12.1% |
| Immigrants | Northern Europe | 99.4 /100 | #60 | Exceptional 12.1% |