Malaysian vs Immigrants from Western Asia Female Poverty Among 25-34 Year Olds
COMPARE
Malaysian
Immigrants from Western Asia
Female Poverty Among 25-34 Year Olds
Female Poverty Among 25-34 Year Olds Comparison
Malaysians
Immigrants from Western Asia
14.7%
FEMALE POVERTY AMONG 25-34 YEAR OLDS
1.4/ 100
METRIC RATING
239th/ 347
METRIC RANK
12.8%
FEMALE POVERTY AMONG 25-34 YEAR OLDS
92.7/ 100
METRIC RATING
122nd/ 347
METRIC RANK
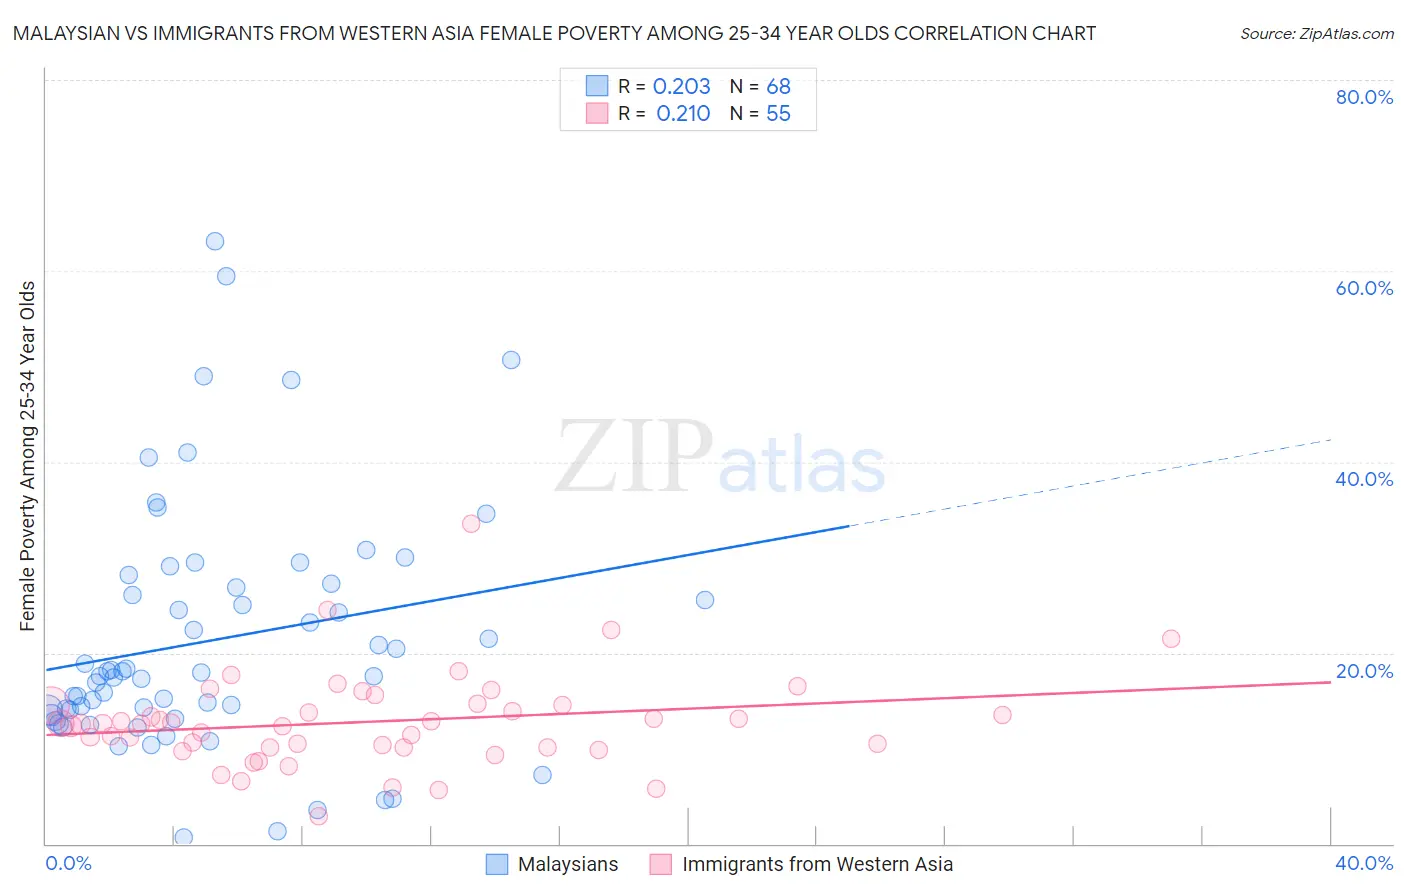
Malaysian vs Immigrants from Western Asia Female Poverty Among 25-34 Year Olds Correlation Chart
The statistical analysis conducted on geographies consisting of 224,654,876 people shows a weak positive correlation between the proportion of Malaysians and poverty level among females between the ages 25 and 34 in the United States with a correlation coefficient (R) of 0.203 and weighted average of 14.7%. Similarly, the statistical analysis conducted on geographies consisting of 397,039,286 people shows a weak positive correlation between the proportion of Immigrants from Western Asia and poverty level among females between the ages 25 and 34 in the United States with a correlation coefficient (R) of 0.210 and weighted average of 12.8%, a difference of 15.0%.
Female Poverty Among 25-34 Year Olds Correlation Summary
| Measurement | Malaysian | Immigrants from Western Asia |
| Minimum | 0.70% | 2.9% |
| Maximum | 63.1% | 33.5% |
| Range | 62.4% | 30.6% |
| Mean | 21.3% | 12.8% |
| Median | 17.8% | 12.6% |
| Interquartile 25% (IQ1) | 13.7% | 10.1% |
| Interquartile 75% (IQ3) | 27.1% | 14.6% |
| Interquartile Range (IQR) | 13.3% | 4.5% |
| Standard Deviation (Sample) | 12.8% | 5.0% |
| Standard Deviation (Population) | 12.7% | 4.9% |
Similar Demographics by Female Poverty Among 25-34 Year Olds
Demographics Similar to Malaysians by Female Poverty Among 25-34 Year Olds
In terms of female poverty among 25-34 year olds, the demographic groups most similar to Malaysians are Alsatian (14.7%, a difference of 0.030%), Immigrants from Grenada (14.7%, a difference of 0.050%), Salvadoran (14.7%, a difference of 0.070%), Immigrants from Ghana (14.7%, a difference of 0.070%), and Immigrants from Jamaica (14.7%, a difference of 0.090%).
| Demographics | Rating | Rank | Female Poverty Among 25-34 Year Olds |
| Immigrants | Ecuador | 1.9 /100 | #232 | Tragic 14.6% |
| Whites/Caucasians | 1.8 /100 | #233 | Tragic 14.7% |
| Cubans | 1.6 /100 | #234 | Tragic 14.7% |
| Immigrants | Jamaica | 1.4 /100 | #235 | Tragic 14.7% |
| Salvadorans | 1.4 /100 | #236 | Tragic 14.7% |
| Immigrants | Ghana | 1.4 /100 | #237 | Tragic 14.7% |
| Alsatians | 1.4 /100 | #238 | Tragic 14.7% |
| Malaysians | 1.4 /100 | #239 | Tragic 14.7% |
| Immigrants | Grenada | 1.3 /100 | #240 | Tragic 14.7% |
| Scotch-Irish | 1.2 /100 | #241 | Tragic 14.8% |
| Barbadians | 1.2 /100 | #242 | Tragic 14.8% |
| Immigrants | Nicaragua | 1.1 /100 | #243 | Tragic 14.8% |
| Immigrants | Bangladesh | 1.1 /100 | #244 | Tragic 14.8% |
| Immigrants | Middle Africa | 1.0 /100 | #245 | Tragic 14.8% |
| Jamaicans | 1.0 /100 | #246 | Tragic 14.8% |
Demographics Similar to Immigrants from Western Asia by Female Poverty Among 25-34 Year Olds
In terms of female poverty among 25-34 year olds, the demographic groups most similar to Immigrants from Western Asia are Romanian (12.8%, a difference of 0.020%), Slovene (12.8%, a difference of 0.020%), Carpatho Rusyn (12.8%, a difference of 0.080%), Immigrants from Nepal (12.8%, a difference of 0.090%), and Mongolian (12.8%, a difference of 0.10%).
| Demographics | Rating | Rank | Female Poverty Among 25-34 Year Olds |
| Immigrants | Brazil | 93.3 /100 | #115 | Exceptional 12.8% |
| Chileans | 93.2 /100 | #116 | Exceptional 12.8% |
| Immigrants | Kuwait | 93.1 /100 | #117 | Exceptional 12.8% |
| Mongolians | 93.0 /100 | #118 | Exceptional 12.8% |
| Immigrants | Nepal | 93.0 /100 | #119 | Exceptional 12.8% |
| Carpatho Rusyns | 93.0 /100 | #120 | Exceptional 12.8% |
| Romanians | 92.8 /100 | #121 | Exceptional 12.8% |
| Immigrants | Western Asia | 92.7 /100 | #122 | Exceptional 12.8% |
| Slovenes | 92.7 /100 | #123 | Exceptional 12.8% |
| Immigrants | Netherlands | 92.0 /100 | #124 | Exceptional 12.8% |
| Immigrants | Canada | 91.5 /100 | #125 | Exceptional 12.9% |
| Immigrants | Fiji | 91.2 /100 | #126 | Exceptional 12.9% |
| Czechs | 90.3 /100 | #127 | Exceptional 12.9% |
| Syrians | 90.2 /100 | #128 | Exceptional 12.9% |
| Immigrants | North America | 89.7 /100 | #129 | Excellent 12.9% |