Immigrants from Kuwait vs Filipino Seniors Poverty Over the Age of 65

COMPARE

Immigrants from Kuwait
Race
Ancestry
AfghanAfricanAlaska NativeAlaskan AthabascanAlbanianAleutAlsatianAmericanApacheArabArapahoArgentineanArmenianAssyrian/Chaldean/SyriacAustralianAustrianBahamianBangladeshiBarbadianBasqueBelgianBelizeanBermudanBhutaneseBlackfeetBolivianBrazilianBritishBritish West IndianBulgarianBurmeseCajunCambodianCanadianCape VerdeanCarpatho RusynCelticCentral AmericanCentral American IndianCherokeeCheyenneChickasawChileanChineseChippewaChoctawColombianColvilleComancheCosta RicanCreeCreekCroatianCrowCubanCypriotCzechCzechoslovakianDanishDelawareDominicanDutchDutch West IndianEastern EuropeanEcuadorianEgyptianEnglishEstonianEthiopianEuropeanFijianFinnishFrenchFrench American IndianFrench CanadianGermanGerman RussianGhanaianGreekGuamanian/ChamorroGuatemalanGuyaneseHaitianHmongHonduranHopiHoumaHungarianIcelanderIndian (Asian)IndonesianInupiatIranianIraqiIrishIroquoisIsraeliItalianJamaicanJapaneseJordanianKenyanKiowaKoreanLaotianLatvianLebaneseLiberianLithuanianLumbeeLuxembourgerMacedonianMalaysianMalteseMarshalleseMenomineeMexicanMexican American IndianMongolianMoroccanNative HawaiianNavajoNepaleseNew ZealanderNicaraguanNigerianNorthern EuropeanNorwegianOkinawanOsageOttawaPaiutePakistaniPalestinianPanamanianParaguayanPennsylvania GermanPeruvianPimaPolishPortuguesePotawatomiPuebloPuerto RicanPuget Sound SalishRomanianRussianSalvadoranSamoanScandinavianScotch-IrishScottishSeminoleSenegaleseSerbianShoshoneSierra LeoneanSiouxSlavicSlovakSloveneSomaliSouth AfricanSouth AmericanSouth American IndianSoviet UnionSpaniardSpanishSpanish AmericanSpanish American IndianSri LankanSubsaharan AfricanSudaneseSwedishSwissSyrianTaiwaneseThaiTlingit-HaidaTohono O'OdhamTonganTrinidadian and TobagonianTsimshianTurkishU.S. Virgin IslanderUgandanUkrainianUruguayanUteVenezuelanVietnameseWelshWest IndianYakamaYaquiYugoslavianYumanYup'ikZimbabwean
Immigration
NonimmigrantsImmigrantsAfghanistanAfricaAlbaniaArgentinaArmeniaAsiaAustraliaAustriaBahamasBangladeshBarbadosBelarusBelgiumBelizeBoliviaBosnia and HerzegovinaBrazilBulgariaBurma/MyanmarCabo VerdeCambodiaCameroonCanadaCaribbeanCentral AmericaChileChinaColombiaCongoCosta RicaCroatiaCubaCzechoslovakiaDenmarkDominicaDominican RepublicEastern AfricaEastern AsiaEastern EuropeEcuadorEgyptEl SalvadorEnglandEritreaEthiopiaEuropeFijiFranceGermanyGhanaGreeceGrenadaGuatemalaGuyanaHaitiHondurasHong KongHungaryIndiaIndonesiaIranIraqIrelandIsraelItalyJamaicaJapanJordanKazakhstanKenyaKoreaKuwaitLaosLatin AmericaLatviaLebanonLiberiaLithuaniaMalaysiaMexicoMicronesiaMiddle AfricaMoldovaMoroccoNepalNetherlandsNicaraguaNigeriaNorth AmericaNorth MacedoniaNorthern AfricaNorthern EuropeNorwayOceaniaPakistanPanamaPeruPhilippinesPolandPortugalRomaniaRussiaSaudi ArabiaScotlandSenegalSerbiaSierra LeoneSingaporeSomaliaSouth AfricaSouth AmericaSouth Central AsiaSouth Eastern AsiaSouthern EuropeSpainSri LankaSt. Vincent and the GrenadinesSudanSwedenSwitzerlandSyriaTaiwanThailandTrinidad and TobagoTurkeyUgandaUkraineUruguayUzbekistanVenezuelaVietnamWest IndiesWestern AfricaWestern AsiaWestern EuropeYemenZaireZimbabweAzores
Filipino
Race
Ancestry
AfghanAfricanAlaska NativeAlaskan AthabascanAlbanianAleutAlsatianAmericanApacheArabArapahoArgentineanArmenianAssyrian/Chaldean/SyriacAustralianAustrianBahamianBangladeshiBarbadianBasqueBelgianBelizeanBermudanBhutaneseBlackfeetBolivianBrazilianBritishBritish West IndianBulgarianBurmeseCajunCambodianCanadianCape VerdeanCarpatho RusynCelticCentral AmericanCentral American IndianCherokeeCheyenneChickasawChileanChineseChippewaChoctawColombianColvilleComancheCosta RicanCreeCreekCroatianCrowCubanCypriotCzechCzechoslovakianDanishDelawareDominicanDutchDutch West IndianEastern EuropeanEcuadorianEgyptianEnglishEstonianEthiopianEuropeanFijianFilipinoFinnishFrenchFrench American IndianFrench CanadianGermanGerman RussianGhanaianGreekGuamanian/ChamorroGuatemalanGuyaneseHaitianHmongHonduranHopiHoumaHungarianIcelanderIndian (Asian)IndonesianInupiatIranianIraqiIrishIroquoisIsraeliItalianJamaicanJapaneseJordanianKenyanKiowaKoreanLaotianLatvianLebaneseLiberianLithuanianLumbeeLuxembourgerMacedonianMalaysianMalteseMarshalleseMenomineeMexicanMexican American IndianMongolianMoroccanNative HawaiianNavajoNepaleseNew ZealanderNicaraguanNigerianNorthern EuropeanNorwegianOkinawanOsageOttawaPaiutePakistaniPalestinianPanamanianParaguayanPennsylvania GermanPeruvianPimaPolishPortuguesePotawatomiPuebloPuerto RicanPuget Sound SalishRomanianRussianSalvadoranSamoanScandinavianScotch-IrishScottishSeminoleSenegaleseSerbianShoshoneSierra LeoneanSiouxSlavicSlovakSloveneSomaliSouth AfricanSouth AmericanSouth American IndianSoviet UnionSpaniardSpanishSpanish AmericanSpanish American IndianSri LankanSubsaharan AfricanSudaneseSwedishSwissSyrianTaiwaneseThaiTlingit-HaidaTohono O'OdhamTonganTrinidadian and TobagonianTsimshianTurkishU.S. Virgin IslanderUgandanUkrainianUruguayanUteVenezuelanVietnameseWelshWest IndianYakamaYaquiYugoslavianYumanYup'ikZimbabwean
Immigration
NonimmigrantsImmigrantsAfghanistanAfricaAlbaniaArgentinaArmeniaAsiaAustraliaAustriaBahamasBangladeshBarbadosBelarusBelgiumBelizeBoliviaBosnia and HerzegovinaBrazilBulgariaBurma/MyanmarCabo VerdeCambodiaCameroonCanadaCaribbeanCentral AmericaChileChinaColombiaCongoCosta RicaCroatiaCubaCzechoslovakiaDenmarkDominicaDominican RepublicEastern AfricaEastern AsiaEastern EuropeEcuadorEgyptEl SalvadorEnglandEritreaEthiopiaEuropeFijiFranceGermanyGhanaGreeceGrenadaGuatemalaGuyanaHaitiHondurasHong KongHungaryIndiaIndonesiaIranIraqIrelandIsraelItalyJamaicaJapanJordanKazakhstanKenyaKoreaLaosLatin AmericaLatviaLebanonLiberiaLithuaniaMalaysiaMexicoMicronesiaMiddle AfricaMoldovaMoroccoNepalNetherlandsNicaraguaNigeriaNorth AmericaNorth MacedoniaNorthern AfricaNorthern EuropeNorwayOceaniaPakistanPanamaPeruPhilippinesPolandPortugalRomaniaRussiaSaudi ArabiaScotlandSenegalSerbiaSierra LeoneSingaporeSomaliaSouth AfricaSouth AmericaSouth Central AsiaSouth Eastern AsiaSouthern EuropeSpainSri LankaSt. Vincent and the GrenadinesSudanSwedenSwitzerlandSyriaTaiwanThailandTrinidad and TobagoTurkeyUgandaUkraineUruguayUzbekistanVenezuelaVietnamWest IndiesWestern AfricaWestern AsiaWestern EuropeYemenZaireZimbabweAzores
Seniors Poverty Over the Age of 65
Income
Poverty
Unemployment
Labor Participation
Family Structure
Vehicle Availability
Education Level
Disability

Seniors Poverty Over the Age of 65 Comparison

Immigrants from Kuwait

Filipinos

Exceptional
Exceptional
10.2%
SENIORS POVERTY OVER THE AGE OF 65
95.5/ 100
METRIC RATING
98th/ 347
METRIC RANK
9.7%
SENIORS POVERTY OVER THE AGE OF 65
99.3/ 100
METRIC RATING
52nd/ 347
METRIC RANK

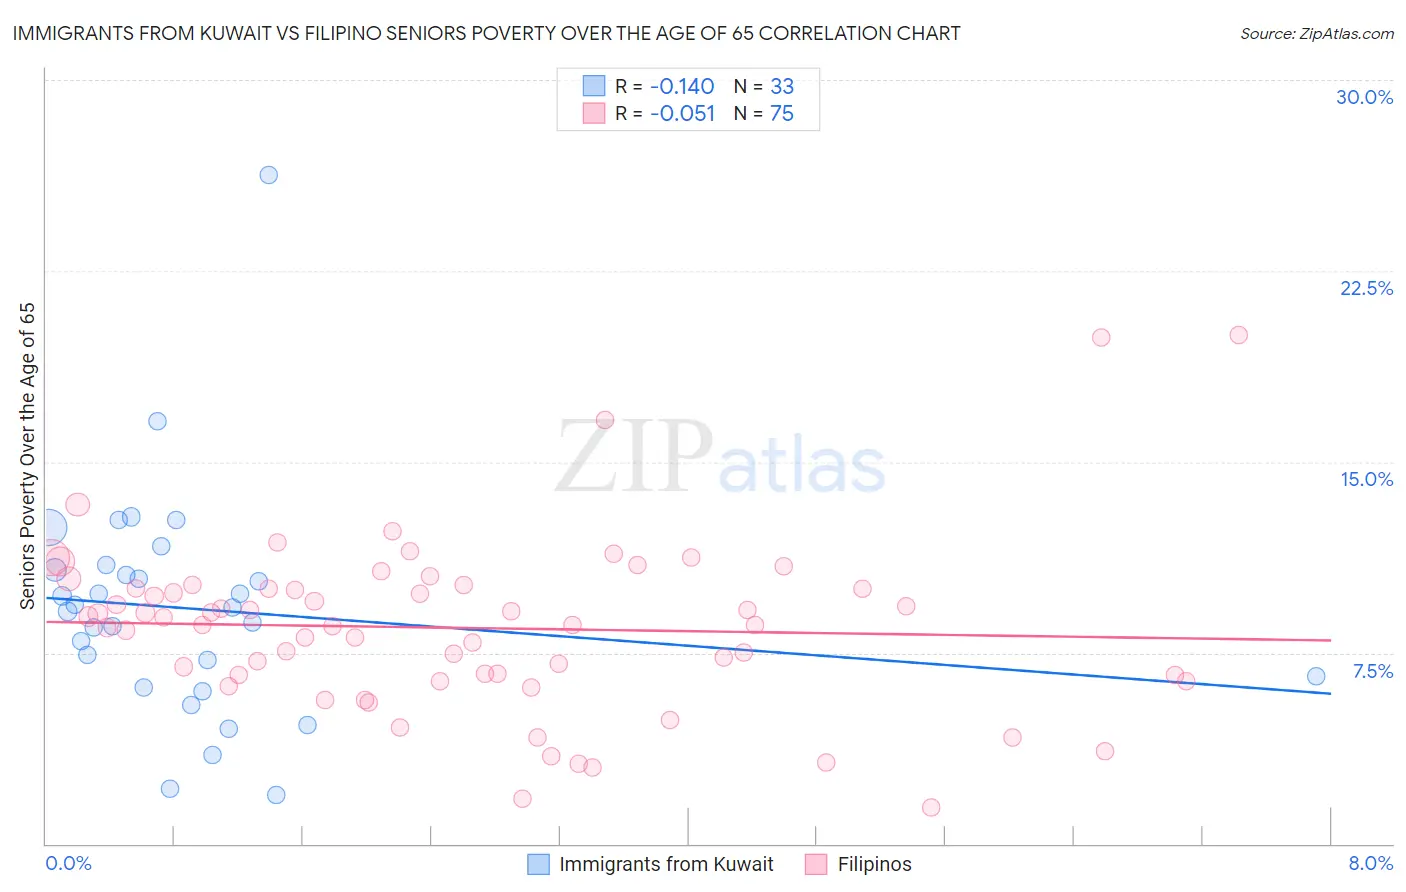
Immigrants from Kuwait vs Filipino Seniors Poverty Over the Age of 65 Correlation Chart

The statistical analysis conducted on geographies consisting of 136,807,849 people shows a poor negative correlation between the proportion of Immigrants from Kuwait and poverty level among seniors over the age of 65 in the United States with a correlation coefficient (R) of -0.140 and weighted average of 10.2%. Similarly, the statistical analysis conducted on geographies consisting of 253,734,434 people shows a slight negative correlation between the proportion of Filipinos and poverty level among seniors over the age of 65 in the United States with a correlation coefficient (R) of -0.051 and weighted average of 9.7%, a difference of 4.6%.
Immigrants from Kuwait vs Filipino Seniors Poverty Over the Age of 65

Seniors Poverty Over the Age of 65 Correlation Summary

MeasurementImmigrants from KuwaitFilipino
Minimum1.9%1.4%
Maximum26.3%20.0%
Range24.3%18.6%
Mean9.2%8.5%
Median9.3%8.6%
Interquartile 25% (IQ1)6.4%6.6%
Interquartile 75% (IQ3)10.9%10.0%
Interquartile Range (IQR)4.5%3.4%
Standard Deviation (Sample)4.5%3.4%
Standard Deviation (Population)4.4%3.3%

Similar Demographics by Seniors Poverty Over the Age of 65

Demographics Similar to Immigrants from Kuwait by Seniors Poverty Over the Age of 65

In terms of seniors poverty over the age of 65, the demographic groups most similar to Immigrants from Kuwait are Cypriot (10.2%, a difference of 0.0%), Marshallese (10.2%, a difference of 0.070%), Immigrants from Pakistan (10.2%, a difference of 0.16%), Basque (10.2%, a difference of 0.24%), and Immigrants from Jordan (10.2%, a difference of 0.39%).
DemographicsRating | RankSeniors Poverty Over the Age of 65
Puget Sound Salish
96.9
/100
|
#91
Exceptional
10.1%
Immigrants | Singapore
96.9
/100
|
#92
Exceptional
10.1%
Immigrants | Sweden
96.7
/100
|
#93
Exceptional
10.1%
Immigrants | Germany
96.7
/100
|
#94
Exceptional
10.1%
Immigrants | Japan
96.3
/100
|
#95
Exceptional
10.1%
Basques
95.9
/100
|
#96
Exceptional
10.2%
Immigrants | Pakistan
95.7
/100
|
#97
Exceptional
10.2%
Immigrants | Kuwait
95.5
/100
|
#98
Exceptional
10.2%
Cypriots
95.5
/100
|
#99
Exceptional
10.2%
Marshallese
95.3
/100
|
#100
Exceptional
10.2%
Immigrants | Jordan
94.7
/100
|
#101
Exceptional
10.2%
Delaware
94.5
/100
|
#102
Exceptional
10.2%
Icelanders
94.4
/100
|
#103
Exceptional
10.3%
South Africans
94.3
/100
|
#104
Exceptional
10.3%
Aleuts
94.1
/100
|
#105
Exceptional
10.3%

Demographics Similar to Filipinos by Seniors Poverty Over the Age of 65

In terms of seniors poverty over the age of 65, the demographic groups most similar to Filipinos are Carpatho Rusyn (9.7%, a difference of 0.020%), Slavic (9.8%, a difference of 0.11%), Immigrants from Northern Europe (9.8%, a difference of 0.16%), Afghan (9.8%, a difference of 0.29%), and Immigrants from England (9.8%, a difference of 0.41%).
DemographicsRating | RankSeniors Poverty Over the Age of 65
Estonians
99.5
/100
|
#45
Exceptional
9.6%
Immigrants | Taiwan
99.5
/100
|
#46
Exceptional
9.7%
Immigrants | South Central Asia
99.5
/100
|
#47
Exceptional
9.7%
French
99.5
/100
|
#48
Exceptional
9.7%
Immigrants | Lithuania
99.4
/100
|
#49
Exceptional
9.7%
Hungarians
99.4
/100
|
#50
Exceptional
9.7%
Carpatho Rusyns
99.3
/100
|
#51
Exceptional
9.7%
Filipinos
99.3
/100
|
#52
Exceptional
9.7%
Slavs
99.2
/100
|
#53
Exceptional
9.8%
Immigrants | Northern Europe
99.2
/100
|
#54
Exceptional
9.8%
Afghans
99.2
/100
|
#55
Exceptional
9.8%
Immigrants | England
99.1
/100
|
#56
Exceptional
9.8%
Bolivians
99.1
/100
|
#57
Exceptional
9.8%
Serbians
99.1
/100
|
#58
Exceptional
9.8%
Immigrants | Canada
99.0
/100
|
#59
Exceptional
9.8%