Luxembourger vs Immigrants from Korea No Vehicles in Household
COMPARE
Luxembourger
Immigrants from Korea
No Vehicles in Household
No Vehicles in Household Comparison
Luxembourgers
Immigrants from Korea
5.4%
NO VEHICLES IN HOUSEHOLD
100.0/ 100
METRIC RATING
1st/ 347
METRIC RANK
9.6%
NO VEHICLES IN HOUSEHOLD
90.9/ 100
METRIC RATING
124th/ 347
METRIC RANK
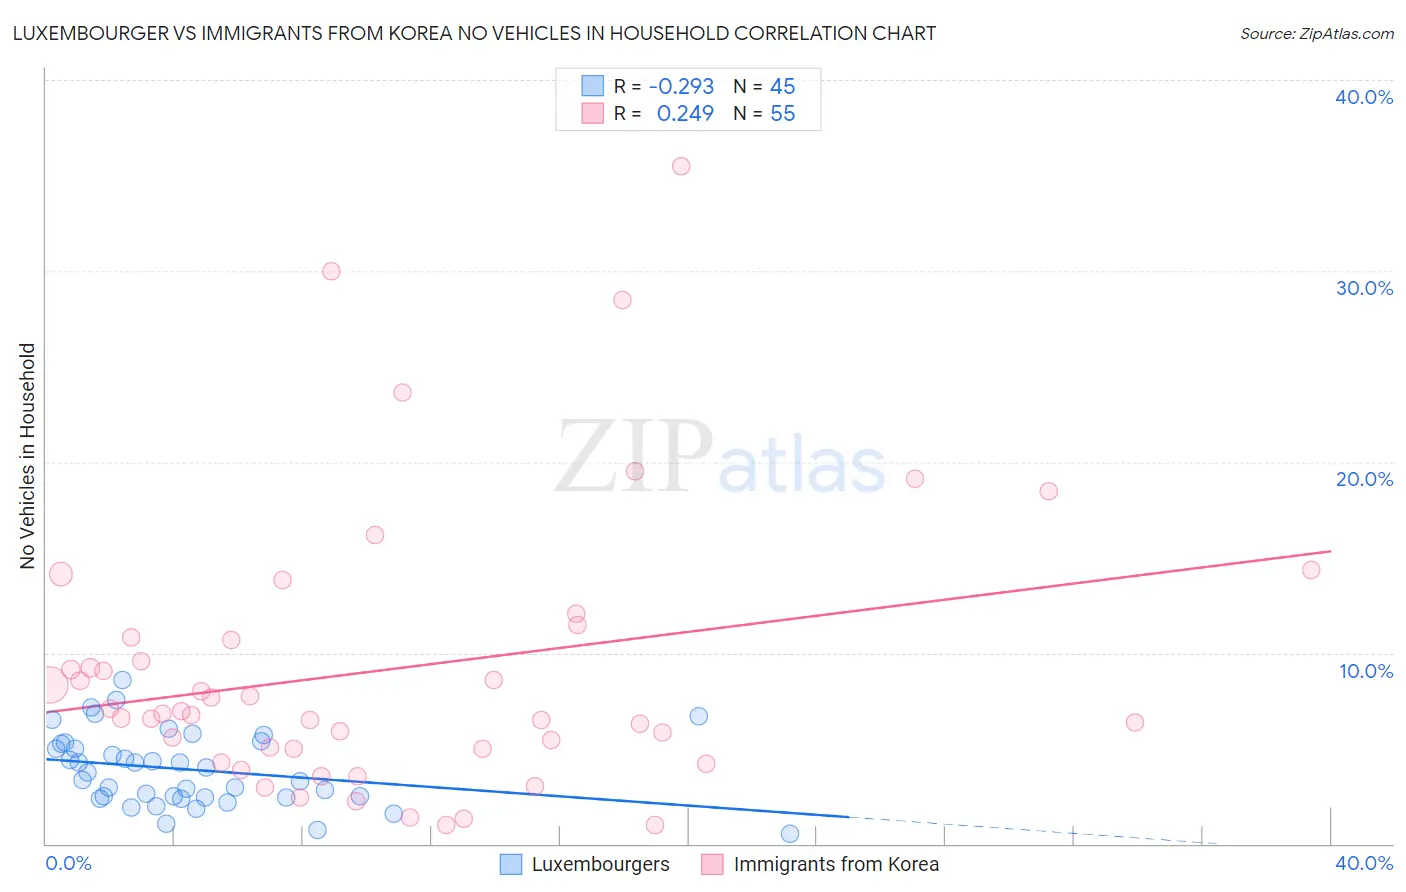
Luxembourger vs Immigrants from Korea No Vehicles in Household Correlation Chart
The statistical analysis conducted on geographies consisting of 11,375,262 people shows a weak negative correlation between the proportion of Luxembourgers and percentage of households with no vehicle available in the United States with a correlation coefficient (R) of -0.293 and weighted average of 5.4%. Similarly, the statistical analysis conducted on geographies consisting of 415,000,700 people shows a weak positive correlation between the proportion of Immigrants from Korea and percentage of households with no vehicle available in the United States with a correlation coefficient (R) of 0.249 and weighted average of 9.6%, a difference of 79.1%.
No Vehicles in Household Correlation Summary
| Measurement | Luxembourger | Immigrants from Korea |
| Minimum | 0.55% | 0.98% |
| Maximum | 8.6% | 35.5% |
| Range | 8.0% | 34.5% |
| Mean | 3.9% | 9.1% |
| Median | 3.7% | 6.8% |
| Interquartile 25% (IQ1) | 2.4% | 5.0% |
| Interquartile 75% (IQ3) | 5.3% | 10.8% |
| Interquartile Range (IQR) | 2.9% | 5.8% |
| Standard Deviation (Sample) | 1.9% | 7.3% |
| Standard Deviation (Population) | 1.9% | 7.2% |
Similar Demographics by No Vehicles in Household
Demographics Similar to Luxembourgers by No Vehicles in Household
In terms of no vehicles in household, the demographic groups most similar to Luxembourgers are Norwegian (6.4%, a difference of 20.2%), English (6.5%, a difference of 21.5%), Danish (6.6%, a difference of 23.0%), Yakama (6.6%, a difference of 23.4%), and German (6.7%, a difference of 24.6%).
| Demographics | Rating | Rank | No Vehicles in Household |
| Luxembourgers | 100.0 /100 | #1 | Exceptional 5.4% |
| Norwegians | 100.0 /100 | #2 | Exceptional 6.4% |
| English | 100.0 /100 | #3 | Exceptional 6.5% |
| Danes | 100.0 /100 | #4 | Exceptional 6.6% |
| Yakama | 100.0 /100 | #5 | Exceptional 6.6% |
| Germans | 100.0 /100 | #6 | Exceptional 6.7% |
| Scottish | 100.0 /100 | #7 | Exceptional 6.8% |
| Swedes | 100.0 /100 | #8 | Exceptional 6.8% |
| Scotch-Irish | 100.0 /100 | #9 | Exceptional 6.8% |
| Dutch | 100.0 /100 | #10 | Exceptional 6.8% |
| Czechs | 100.0 /100 | #11 | Exceptional 6.9% |
| Assyrians/Chaldeans/Syriacs | 100.0 /100 | #12 | Exceptional 7.0% |
| Scandinavians | 100.0 /100 | #13 | Exceptional 7.0% |
| Mexicans | 100.0 /100 | #14 | Exceptional 7.0% |
| Whites/Caucasians | 100.0 /100 | #15 | Exceptional 7.0% |
Demographics Similar to Immigrants from Korea by No Vehicles in Household
In terms of no vehicles in household, the demographic groups most similar to Immigrants from Korea are Immigrants from Cameroon (9.6%, a difference of 0.13%), Blackfeet (9.6%, a difference of 0.23%), Icelander (9.6%, a difference of 0.30%), Immigrants from Kenya (9.6%, a difference of 0.48%), and Immigrants from Syria (9.6%, a difference of 0.56%).
| Demographics | Rating | Rank | No Vehicles in Household |
| Chippewa | 93.8 /100 | #117 | Exceptional 9.4% |
| Greeks | 92.9 /100 | #118 | Exceptional 9.5% |
| Fijians | 92.7 /100 | #119 | Exceptional 9.5% |
| Immigrants | Thailand | 92.6 /100 | #120 | Exceptional 9.5% |
| Puget Sound Salish | 92.4 /100 | #121 | Exceptional 9.5% |
| Costa Ricans | 92.3 /100 | #122 | Exceptional 9.5% |
| Blackfeet | 91.4 /100 | #123 | Exceptional 9.6% |
| Immigrants | Korea | 90.9 /100 | #124 | Exceptional 9.6% |
| Immigrants | Cameroon | 90.6 /100 | #125 | Exceptional 9.6% |
| Icelanders | 90.2 /100 | #126 | Exceptional 9.6% |
| Immigrants | Kenya | 89.7 /100 | #127 | Excellent 9.6% |
| Immigrants | Syria | 89.5 /100 | #128 | Excellent 9.6% |
| Nicaraguans | 89.5 /100 | #129 | Excellent 9.7% |
| Burmese | 88.8 /100 | #130 | Excellent 9.7% |
| Immigrants | Azores | 88.2 /100 | #131 | Excellent 9.7% |