Luxembourger vs Immigrants from Egypt Unemployment Among Women with Children Under 18 years
COMPARE
Luxembourger
Immigrants from Egypt
Unemployment Among Women with Children Under 18 years
Unemployment Among Women with Children Under 18 years Comparison
Luxembourgers
Immigrants from Egypt
5.0%
UNEMPLOYMENT AMONG WOMEN WITH CHILDREN UNDER 18 YEARS
99.2/ 100
METRIC RATING
35th/ 347
METRIC RANK
5.3%
UNEMPLOYMENT AMONG WOMEN WITH CHILDREN UNDER 18 YEARS
74.0/ 100
METRIC RATING
145th/ 347
METRIC RANK
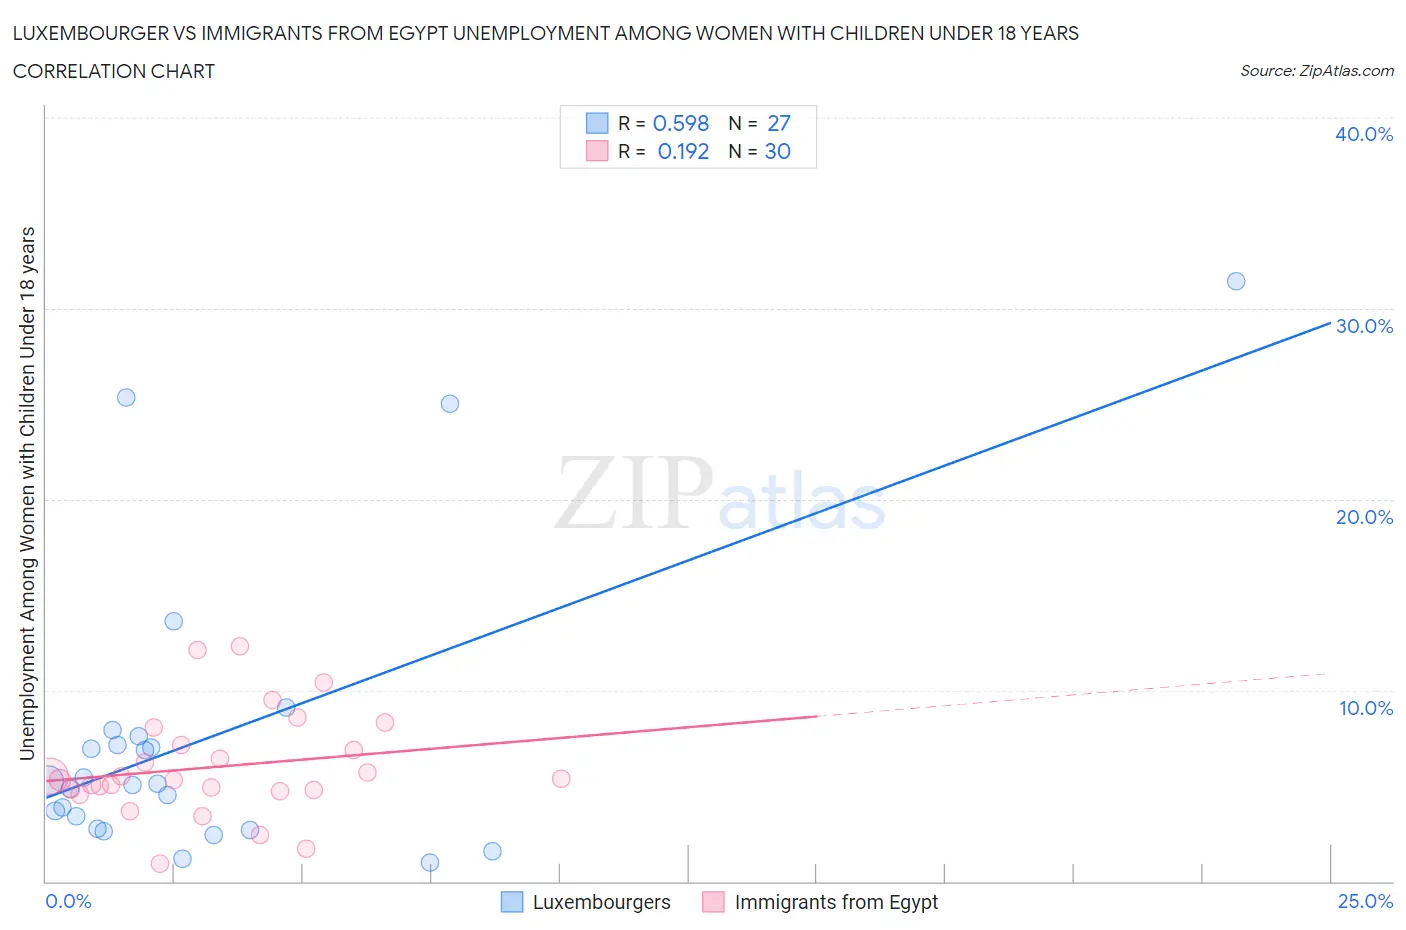
Luxembourger vs Immigrants from Egypt Unemployment Among Women with Children Under 18 years Correlation Chart
The statistical analysis conducted on geographies consisting of 140,445,950 people shows a substantial positive correlation between the proportion of Luxembourgers and unemployment rate among women with children under the age of 18 in the United States with a correlation coefficient (R) of 0.598 and weighted average of 5.0%. Similarly, the statistical analysis conducted on geographies consisting of 240,640,454 people shows a poor positive correlation between the proportion of Immigrants from Egypt and unemployment rate among women with children under the age of 18 in the United States with a correlation coefficient (R) of 0.192 and weighted average of 5.3%, a difference of 7.4%.
Unemployment Among Women with Children Under 18 years Correlation Summary
| Measurement | Luxembourger | Immigrants from Egypt |
| Minimum | 1.0% | 0.90% |
| Maximum | 31.4% | 12.3% |
| Range | 30.4% | 11.4% |
| Mean | 7.5% | 6.0% |
| Median | 5.1% | 5.3% |
| Interquartile 25% (IQ1) | 2.7% | 4.8% |
| Interquartile 75% (IQ3) | 7.6% | 7.1% |
| Interquartile Range (IQR) | 4.8% | 2.3% |
| Standard Deviation (Sample) | 7.7% | 2.7% |
| Standard Deviation (Population) | 7.5% | 2.6% |
Similar Demographics by Unemployment Among Women with Children Under 18 years
Demographics Similar to Luxembourgers by Unemployment Among Women with Children Under 18 years
In terms of unemployment among women with children under 18 years, the demographic groups most similar to Luxembourgers are Immigrants from South Central Asia (5.0%, a difference of 0.050%), Mongolian (5.0%, a difference of 0.060%), Polish (5.0%, a difference of 0.080%), Bhutanese (5.0%, a difference of 0.11%), and English (5.0%, a difference of 0.22%).
| Demographics | Rating | Rank | Unemployment Among Women with Children Under 18 years |
| Immigrants | Eastern Asia | 99.5 /100 | #28 | Exceptional 4.9% |
| Finns | 99.4 /100 | #29 | Exceptional 4.9% |
| Burmese | 99.4 /100 | #30 | Exceptional 4.9% |
| Cypriots | 99.3 /100 | #31 | Exceptional 5.0% |
| Dutch | 99.3 /100 | #32 | Exceptional 5.0% |
| Croatians | 99.3 /100 | #33 | Exceptional 5.0% |
| Immigrants | South Central Asia | 99.2 /100 | #34 | Exceptional 5.0% |
| Luxembourgers | 99.2 /100 | #35 | Exceptional 5.0% |
| Mongolians | 99.2 /100 | #36 | Exceptional 5.0% |
| Poles | 99.2 /100 | #37 | Exceptional 5.0% |
| Bhutanese | 99.2 /100 | #38 | Exceptional 5.0% |
| English | 99.1 /100 | #39 | Exceptional 5.0% |
| Greeks | 99.0 /100 | #40 | Exceptional 5.0% |
| Immigrants | Bosnia and Herzegovina | 99.0 /100 | #41 | Exceptional 5.0% |
| Eastern Europeans | 98.9 /100 | #42 | Exceptional 5.0% |
Demographics Similar to Immigrants from Egypt by Unemployment Among Women with Children Under 18 years
In terms of unemployment among women with children under 18 years, the demographic groups most similar to Immigrants from Egypt are Immigrants from Belarus (5.3%, a difference of 0.060%), Bangladeshi (5.3%, a difference of 0.070%), Immigrants from England (5.3%, a difference of 0.090%), Chilean (5.3%, a difference of 0.10%), and Immigrants from Western Europe (5.4%, a difference of 0.11%).
| Demographics | Rating | Rank | Unemployment Among Women with Children Under 18 years |
| Argentineans | 78.8 /100 | #138 | Good 5.3% |
| Immigrants | Ukraine | 78.5 /100 | #139 | Good 5.3% |
| Immigrants | Norway | 76.2 /100 | #140 | Good 5.3% |
| Venezuelans | 76.0 /100 | #141 | Good 5.3% |
| Immigrants | Venezuela | 75.4 /100 | #142 | Good 5.3% |
| Chileans | 75.0 /100 | #143 | Good 5.3% |
| Immigrants | England | 74.9 /100 | #144 | Good 5.3% |
| Immigrants | Egypt | 74.0 /100 | #145 | Good 5.3% |
| Immigrants | Belarus | 73.4 /100 | #146 | Good 5.3% |
| Bangladeshis | 73.2 /100 | #147 | Good 5.3% |
| Immigrants | Western Europe | 72.8 /100 | #148 | Good 5.4% |
| Immigrants | Kenya | 72.2 /100 | #149 | Good 5.4% |
| Immigrants | Argentina | 71.7 /100 | #150 | Good 5.4% |
| Immigrants | Iran | 71.1 /100 | #151 | Good 5.4% |
| Immigrants | South Eastern Asia | 71.1 /100 | #152 | Good 5.4% |