Immigrants from Dominica vs Malaysian Receiving Food Stamps
COMPARE
Immigrants from Dominica
Malaysian
Receiving Food Stamps
Receiving Food Stamps Comparison
Immigrants from Dominica
Malaysians
18.4%
RECEIVING FOOD STAMPS
0.0/ 100
METRIC RATING
329th/ 347
METRIC RANK
12.7%
RECEIVING FOOD STAMPS
8.5/ 100
METRIC RATING
212th/ 347
METRIC RANK
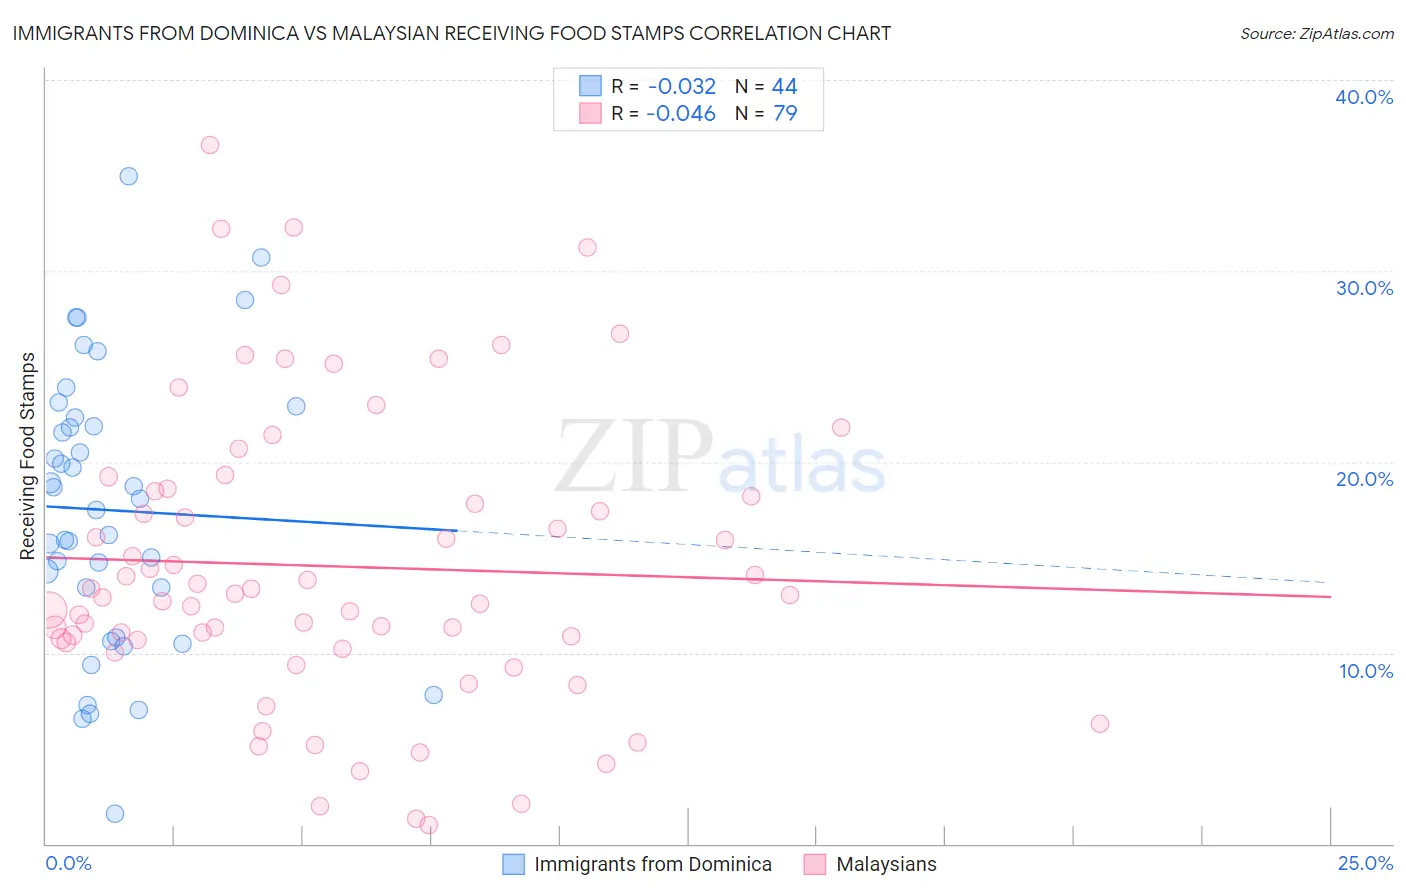
Immigrants from Dominica vs Malaysian Receiving Food Stamps Correlation Chart
The statistical analysis conducted on geographies consisting of 83,761,752 people shows no correlation between the proportion of Immigrants from Dominica and percentage of population receiving government assistance and/or food stamps in the United States with a correlation coefficient (R) of -0.032 and weighted average of 18.4%. Similarly, the statistical analysis conducted on geographies consisting of 225,895,632 people shows no correlation between the proportion of Malaysians and percentage of population receiving government assistance and/or food stamps in the United States with a correlation coefficient (R) of -0.046 and weighted average of 12.7%, a difference of 44.8%.
Receiving Food Stamps Correlation Summary
| Measurement | Immigrants from Dominica | Malaysian |
| Minimum | 1.6% | 1.0% |
| Maximum | 35.0% | 36.6% |
| Range | 33.4% | 35.6% |
| Mean | 17.5% | 14.5% |
| Median | 17.8% | 13.0% |
| Interquartile 25% (IQ1) | 12.1% | 10.5% |
| Interquartile 75% (IQ3) | 22.1% | 18.5% |
| Interquartile Range (IQR) | 10.0% | 8.0% |
| Standard Deviation (Sample) | 7.3% | 7.7% |
| Standard Deviation (Population) | 7.2% | 7.6% |
Similar Demographics by Receiving Food Stamps
Demographics Similar to Immigrants from Dominica by Receiving Food Stamps
In terms of receiving food stamps, the demographic groups most similar to Immigrants from Dominica are Colville (18.3%, a difference of 0.46%), Apache (18.3%, a difference of 0.67%), Cuban (18.2%, a difference of 0.98%), Immigrants from Haiti (18.2%, a difference of 1.1%), and British West Indian (17.9%, a difference of 2.9%).
| Demographics | Rating | Rank | Receiving Food Stamps |
| Immigrants | Grenada | 0.0 /100 | #322 | Tragic 17.8% |
| Haitians | 0.0 /100 | #323 | Tragic 17.8% |
| British West Indians | 0.0 /100 | #324 | Tragic 17.9% |
| Immigrants | Haiti | 0.0 /100 | #325 | Tragic 18.2% |
| Cubans | 0.0 /100 | #326 | Tragic 18.2% |
| Apache | 0.0 /100 | #327 | Tragic 18.3% |
| Colville | 0.0 /100 | #328 | Tragic 18.3% |
| Immigrants | Dominica | 0.0 /100 | #329 | Tragic 18.4% |
| Pima | 0.0 /100 | #330 | Tragic 19.0% |
| Immigrants | Caribbean | 0.0 /100 | #331 | Tragic 19.6% |
| Pueblo | 0.0 /100 | #332 | Tragic 19.9% |
| Inupiat | 0.0 /100 | #333 | Tragic 20.1% |
| Yuman | 0.0 /100 | #334 | Tragic 20.2% |
| Immigrants | Cuba | 0.0 /100 | #335 | Tragic 20.8% |
| Navajo | 0.0 /100 | #336 | Tragic 21.1% |
Demographics Similar to Malaysians by Receiving Food Stamps
In terms of receiving food stamps, the demographic groups most similar to Malaysians are Moroccan (12.8%, a difference of 0.40%), Immigrants from Africa (12.8%, a difference of 0.43%), Colombian (12.6%, a difference of 0.63%), Native Hawaiian (12.8%, a difference of 0.87%), and Immigrants from South America (12.8%, a difference of 0.98%).
| Demographics | Rating | Rank | Receiving Food Stamps |
| Aleuts | 17.3 /100 | #205 | Poor 12.4% |
| Immigrants | Thailand | 17.0 /100 | #206 | Poor 12.4% |
| South Americans | 16.0 /100 | #207 | Poor 12.4% |
| Potawatomi | 14.6 /100 | #208 | Poor 12.5% |
| Immigrants | Sierra Leone | 12.9 /100 | #209 | Poor 12.5% |
| Immigrants | Uruguay | 12.8 /100 | #210 | Poor 12.5% |
| Colombians | 10.2 /100 | #211 | Poor 12.6% |
| Malaysians | 8.5 /100 | #212 | Tragic 12.7% |
| Moroccans | 7.6 /100 | #213 | Tragic 12.8% |
| Immigrants | Africa | 7.6 /100 | #214 | Tragic 12.8% |
| Native Hawaiians | 6.7 /100 | #215 | Tragic 12.8% |
| Immigrants | South America | 6.5 /100 | #216 | Tragic 12.8% |
| Immigrants | Burma/Myanmar | 6.0 /100 | #217 | Tragic 12.9% |
| Hawaiians | 5.4 /100 | #218 | Tragic 12.9% |
| Immigrants | Middle Africa | 5.4 /100 | #219 | Tragic 12.9% |