Lithuanian vs Bhutanese Single Father Poverty
COMPARE
Lithuanian
Bhutanese
Single Father Poverty
Single Father Poverty Comparison
Lithuanians
Bhutanese
17.3%
SINGLE FATHER POVERTY
0.4/ 100
METRIC RATING
263rd/ 347
METRIC RANK
15.0%
SINGLE FATHER POVERTY
99.9/ 100
METRIC RATING
50th/ 347
METRIC RANK
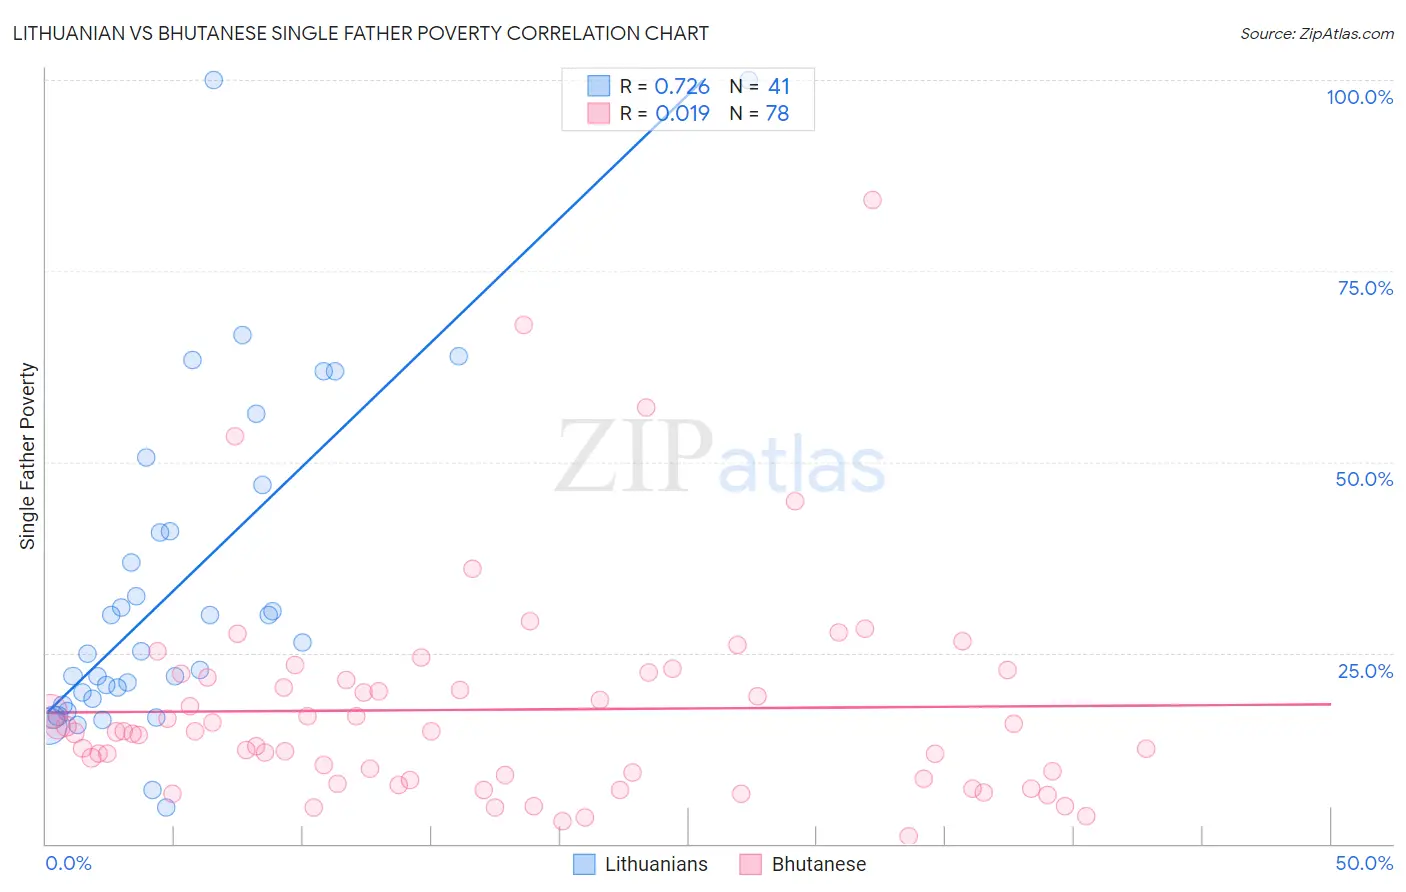
Lithuanian vs Bhutanese Single Father Poverty Correlation Chart
The statistical analysis conducted on geographies consisting of 319,660,804 people shows a strong positive correlation between the proportion of Lithuanians and poverty level among single fathers in the United States with a correlation coefficient (R) of 0.726 and weighted average of 17.3%. Similarly, the statistical analysis conducted on geographies consisting of 350,288,163 people shows no correlation between the proportion of Bhutanese and poverty level among single fathers in the United States with a correlation coefficient (R) of 0.019 and weighted average of 15.0%, a difference of 15.5%.
Single Father Poverty Correlation Summary
| Measurement | Lithuanian | Bhutanese |
| Minimum | 4.8% | 0.92% |
| Maximum | 100.0% | 84.3% |
| Range | 95.2% | 83.3% |
| Mean | 33.8% | 17.6% |
| Median | 25.2% | 14.7% |
| Interquartile 25% (IQ1) | 18.5% | 8.5% |
| Interquartile 75% (IQ3) | 44.0% | 21.8% |
| Interquartile Range (IQR) | 25.5% | 13.3% |
| Standard Deviation (Sample) | 22.3% | 14.1% |
| Standard Deviation (Population) | 22.1% | 14.0% |
Similar Demographics by Single Father Poverty
Demographics Similar to Lithuanians by Single Father Poverty
In terms of single father poverty, the demographic groups most similar to Lithuanians are Immigrants from Zaire (17.3%, a difference of 0.010%), Swiss (17.3%, a difference of 0.14%), Slovene (17.3%, a difference of 0.20%), Polish (17.3%, a difference of 0.21%), and Jamaican (17.3%, a difference of 0.26%).
| Demographics | Rating | Rank | Single Father Poverty |
| Immigrants | Haiti | 0.8 /100 | #256 | Tragic 17.2% |
| Immigrants | Albania | 0.7 /100 | #257 | Tragic 17.2% |
| Albanians | 0.7 /100 | #258 | Tragic 17.2% |
| Immigrants | Jamaica | 0.7 /100 | #259 | Tragic 17.2% |
| Spaniards | 0.6 /100 | #260 | Tragic 17.2% |
| Swiss | 0.5 /100 | #261 | Tragic 17.3% |
| Immigrants | Zaire | 0.4 /100 | #262 | Tragic 17.3% |
| Lithuanians | 0.4 /100 | #263 | Tragic 17.3% |
| Slovenes | 0.3 /100 | #264 | Tragic 17.3% |
| Poles | 0.3 /100 | #265 | Tragic 17.3% |
| Jamaicans | 0.3 /100 | #266 | Tragic 17.3% |
| Haitians | 0.3 /100 | #267 | Tragic 17.3% |
| Immigrants | Caribbean | 0.3 /100 | #268 | Tragic 17.4% |
| Slavs | 0.3 /100 | #269 | Tragic 17.4% |
| Indonesians | 0.2 /100 | #270 | Tragic 17.4% |
Demographics Similar to Bhutanese by Single Father Poverty
In terms of single father poverty, the demographic groups most similar to Bhutanese are Immigrants from Pakistan (15.0%, a difference of 0.020%), Immigrants from Eastern Asia (15.0%, a difference of 0.050%), Immigrants from El Salvador (15.0%, a difference of 0.060%), Immigrants from Kenya (15.0%, a difference of 0.090%), and Immigrants from China (14.9%, a difference of 0.21%).
| Demographics | Rating | Rank | Single Father Poverty |
| Immigrants | Eritrea | 100.0 /100 | #43 | Exceptional 14.8% |
| Salvadorans | 100.0 /100 | #44 | Exceptional 14.9% |
| Immigrants | Somalia | 100.0 /100 | #45 | Exceptional 14.9% |
| Immigrants | Cambodia | 99.9 /100 | #46 | Exceptional 14.9% |
| Immigrants | China | 99.9 /100 | #47 | Exceptional 14.9% |
| Malaysians | 99.9 /100 | #48 | Exceptional 14.9% |
| Immigrants | Eastern Asia | 99.9 /100 | #49 | Exceptional 15.0% |
| Bhutanese | 99.9 /100 | #50 | Exceptional 15.0% |
| Immigrants | Pakistan | 99.9 /100 | #51 | Exceptional 15.0% |
| Immigrants | El Salvador | 99.9 /100 | #52 | Exceptional 15.0% |
| Immigrants | Kenya | 99.9 /100 | #53 | Exceptional 15.0% |
| Immigrants | Uzbekistan | 99.9 /100 | #54 | Exceptional 15.0% |
| Immigrants | Bulgaria | 99.9 /100 | #55 | Exceptional 15.0% |
| Immigrants | Laos | 99.9 /100 | #56 | Exceptional 15.1% |
| Laotians | 99.9 /100 | #57 | Exceptional 15.1% |