Immigrants from Chile vs American Child Poverty Under the Age of 5
COMPARE
Immigrants from Chile
American
Child Poverty Under the Age of 5
Child Poverty Under the Age of 5 Comparison
Immigrants from Chile
Americans
16.4%
CHILD POVERTY UNDER THE AGE OF 5
85.3/ 100
METRIC RATING
137th/ 347
METRIC RANK
20.5%
CHILD POVERTY UNDER THE AGE OF 5
0.1/ 100
METRIC RATING
271st/ 347
METRIC RANK
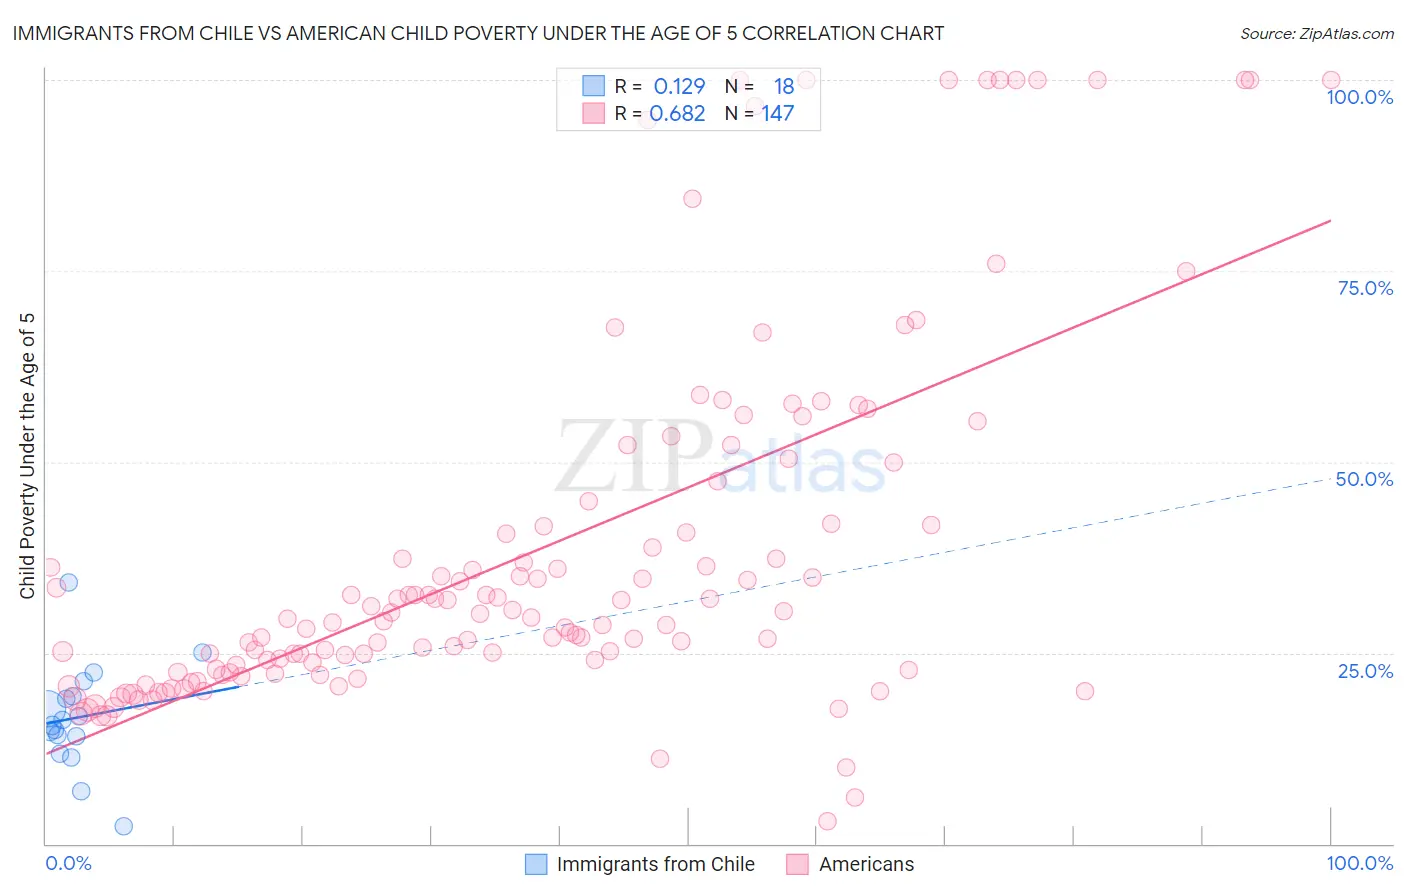
Immigrants from Chile vs American Child Poverty Under the Age of 5 Correlation Chart
The statistical analysis conducted on geographies consisting of 213,144,685 people shows a poor positive correlation between the proportion of Immigrants from Chile and poverty level among children under the age of 5 in the United States with a correlation coefficient (R) of 0.129 and weighted average of 16.4%. Similarly, the statistical analysis conducted on geographies consisting of 538,793,741 people shows a significant positive correlation between the proportion of Americans and poverty level among children under the age of 5 in the United States with a correlation coefficient (R) of 0.682 and weighted average of 20.5%, a difference of 24.4%.
Child Poverty Under the Age of 5 Correlation Summary
| Measurement | Immigrants from Chile | American |
| Minimum | 2.3% | 2.9% |
| Maximum | 34.3% | 100.0% |
| Range | 32.0% | 97.1% |
| Mean | 16.5% | 38.1% |
| Median | 15.9% | 29.6% |
| Interquartile 25% (IQ1) | 14.0% | 22.8% |
| Interquartile 75% (IQ3) | 19.4% | 41.9% |
| Interquartile Range (IQR) | 5.3% | 19.1% |
| Standard Deviation (Sample) | 7.0% | 23.8% |
| Standard Deviation (Population) | 6.8% | 23.7% |
Similar Demographics by Child Poverty Under the Age of 5
Demographics Similar to Immigrants from Chile by Child Poverty Under the Age of 5
In terms of child poverty under the age of 5, the demographic groups most similar to Immigrants from Chile are German (16.5%, a difference of 0.10%), Immigrants from Hungary (16.5%, a difference of 0.16%), Guamanian/Chamorro (16.5%, a difference of 0.23%), Immigrants from Western Europe (16.5%, a difference of 0.42%), and Portuguese (16.5%, a difference of 0.46%).
| Demographics | Rating | Rank | Child Poverty Under the Age of 5 |
| Immigrants | Norway | 89.3 /100 | #130 | Excellent 16.3% |
| Finns | 88.3 /100 | #131 | Excellent 16.3% |
| Serbians | 88.2 /100 | #132 | Excellent 16.3% |
| Icelanders | 87.9 /100 | #133 | Excellent 16.3% |
| Immigrants | North Macedonia | 87.8 /100 | #134 | Excellent 16.4% |
| Brazilians | 87.8 /100 | #135 | Excellent 16.4% |
| Immigrants | Northern Africa | 87.5 /100 | #136 | Excellent 16.4% |
| Immigrants | Chile | 85.3 /100 | #137 | Excellent 16.4% |
| Germans | 84.8 /100 | #138 | Excellent 16.5% |
| Immigrants | Hungary | 84.5 /100 | #139 | Excellent 16.5% |
| Guamanians/Chamorros | 84.2 /100 | #140 | Excellent 16.5% |
| Immigrants | Western Europe | 83.3 /100 | #141 | Excellent 16.5% |
| Portuguese | 83.0 /100 | #142 | Excellent 16.5% |
| Samoans | 83.0 /100 | #143 | Excellent 16.5% |
| Ethiopians | 82.7 /100 | #144 | Excellent 16.5% |
Demographics Similar to Americans by Child Poverty Under the Age of 5
In terms of child poverty under the age of 5, the demographic groups most similar to Americans are Immigrants from Jamaica (20.5%, a difference of 0.12%), Jamaican (20.4%, a difference of 0.45%), Immigrants from Burma/Myanmar (20.4%, a difference of 0.52%), Ottawa (20.3%, a difference of 0.61%), and Belizean (20.3%, a difference of 0.61%).
| Demographics | Rating | Rank | Child Poverty Under the Age of 5 |
| Immigrants | Liberia | 0.1 /100 | #264 | Tragic 20.2% |
| Spanish American Indians | 0.1 /100 | #265 | Tragic 20.2% |
| Aleuts | 0.1 /100 | #266 | Tragic 20.3% |
| Ottawa | 0.1 /100 | #267 | Tragic 20.3% |
| Belizeans | 0.1 /100 | #268 | Tragic 20.3% |
| Immigrants | Burma/Myanmar | 0.1 /100 | #269 | Tragic 20.4% |
| Jamaicans | 0.1 /100 | #270 | Tragic 20.4% |
| Americans | 0.1 /100 | #271 | Tragic 20.5% |
| Immigrants | Jamaica | 0.1 /100 | #272 | Tragic 20.5% |
| Central Americans | 0.1 /100 | #273 | Tragic 20.6% |
| Immigrants | Belize | 0.1 /100 | #274 | Tragic 20.6% |
| Bangladeshis | 0.1 /100 | #275 | Tragic 20.6% |
| West Indians | 0.0 /100 | #276 | Tragic 20.6% |
| Immigrants | West Indies | 0.0 /100 | #277 | Tragic 20.7% |
| Immigrants | Grenada | 0.0 /100 | #278 | Tragic 20.7% |