Liberian vs Immigrants from Canada Seniors Poverty Over the Age of 65
COMPARE
Liberian
Immigrants from Canada
Seniors Poverty Over the Age of 65
Seniors Poverty Over the Age of 65 Comparison
Liberians
Immigrants from Canada
11.8%
SENIORS POVERTY OVER THE AGE OF 65
3.2/ 100
METRIC RATING
226th/ 347
METRIC RANK
9.8%
SENIORS POVERTY OVER THE AGE OF 65
99.0/ 100
METRIC RATING
59th/ 347
METRIC RANK
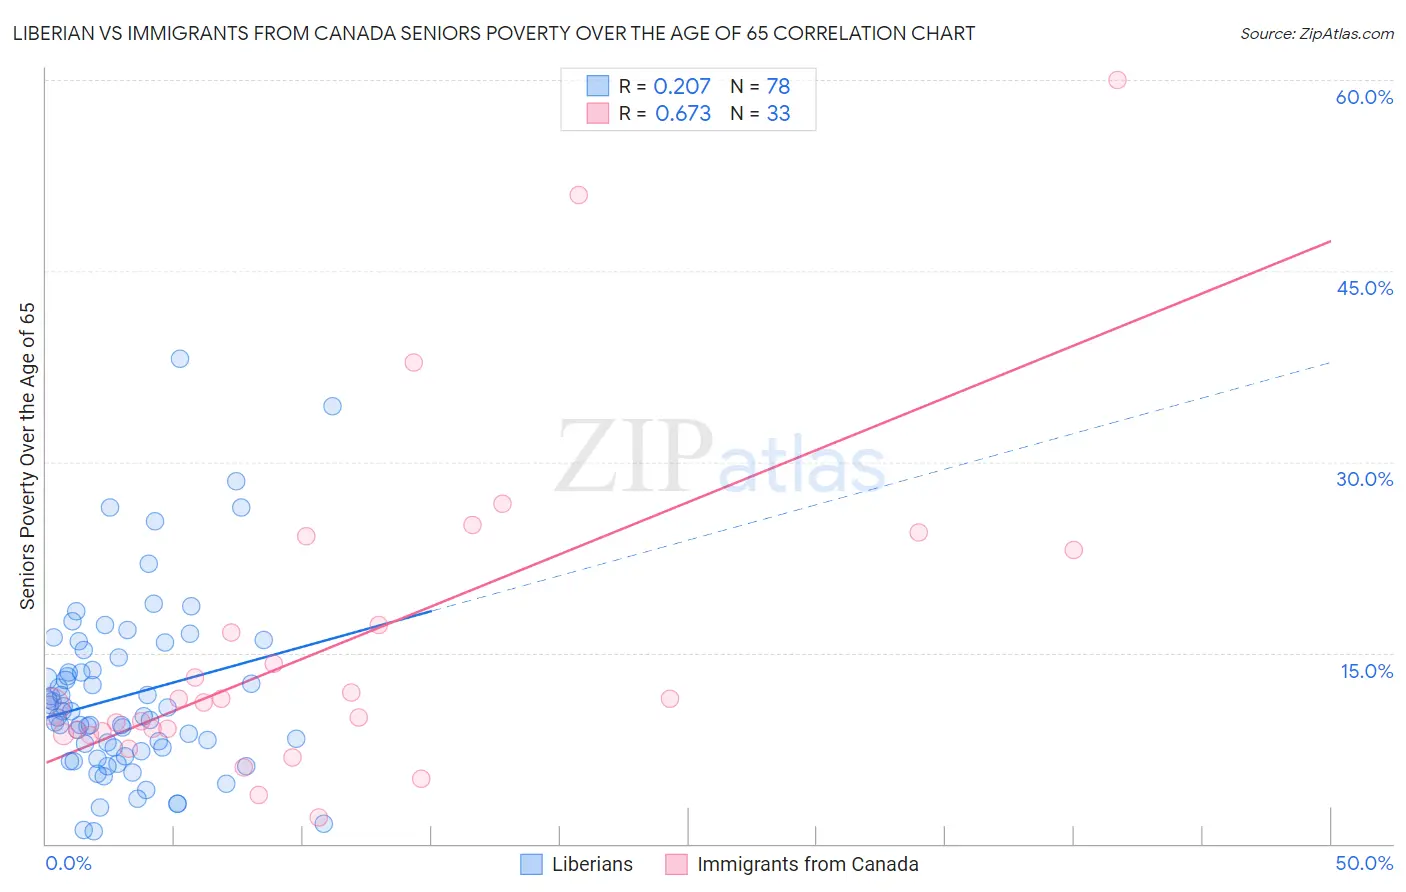
Liberian vs Immigrants from Canada Seniors Poverty Over the Age of 65 Correlation Chart
The statistical analysis conducted on geographies consisting of 117,906,609 people shows a weak positive correlation between the proportion of Liberians and poverty level among seniors over the age of 65 in the United States with a correlation coefficient (R) of 0.207 and weighted average of 11.8%. Similarly, the statistical analysis conducted on geographies consisting of 457,331,043 people shows a significant positive correlation between the proportion of Immigrants from Canada and poverty level among seniors over the age of 65 in the United States with a correlation coefficient (R) of 0.673 and weighted average of 9.8%, a difference of 19.8%.
Seniors Poverty Over the Age of 65 Correlation Summary
| Measurement | Liberian | Immigrants from Canada |
| Minimum | 0.95% | 2.1% |
| Maximum | 38.1% | 60.0% |
| Range | 37.1% | 57.9% |
| Mean | 11.6% | 15.6% |
| Median | 10.2% | 11.1% |
| Interquartile 25% (IQ1) | 7.3% | 8.7% |
| Interquartile 75% (IQ3) | 14.7% | 20.1% |
| Interquartile Range (IQR) | 7.4% | 11.4% |
| Standard Deviation (Sample) | 7.0% | 12.9% |
| Standard Deviation (Population) | 7.0% | 12.7% |
Similar Demographics by Seniors Poverty Over the Age of 65
Demographics Similar to Liberians by Seniors Poverty Over the Age of 65
In terms of seniors poverty over the age of 65, the demographic groups most similar to Liberians are Immigrants from Belarus (11.8%, a difference of 0.020%), Nigerian (11.8%, a difference of 0.030%), Immigrants from Nigeria (11.7%, a difference of 0.12%), Immigrants from Congo (11.7%, a difference of 0.36%), and Immigrants from Costa Rica (11.8%, a difference of 0.36%).
| Demographics | Rating | Rank | Seniors Poverty Over the Age of 65 |
| Arapaho | 5.2 /100 | #219 | Tragic 11.6% |
| Peruvians | 4.2 /100 | #220 | Tragic 11.7% |
| Argentineans | 4.1 /100 | #221 | Tragic 11.7% |
| Immigrants | Chile | 3.9 /100 | #222 | Tragic 11.7% |
| Immigrants | Congo | 3.8 /100 | #223 | Tragic 11.7% |
| Immigrants | Nigeria | 3.4 /100 | #224 | Tragic 11.7% |
| Immigrants | Belarus | 3.2 /100 | #225 | Tragic 11.8% |
| Liberians | 3.2 /100 | #226 | Tragic 11.8% |
| Nigerians | 3.2 /100 | #227 | Tragic 11.8% |
| Immigrants | Costa Rica | 2.7 /100 | #228 | Tragic 11.8% |
| Immigrants | Eritrea | 2.6 /100 | #229 | Tragic 11.8% |
| Bermudans | 2.1 /100 | #230 | Tragic 11.9% |
| Cajuns | 2.0 /100 | #231 | Tragic 11.9% |
| Yaqui | 1.9 /100 | #232 | Tragic 11.9% |
| Panamanians | 1.8 /100 | #233 | Tragic 11.9% |
Demographics Similar to Immigrants from Canada by Seniors Poverty Over the Age of 65
In terms of seniors poverty over the age of 65, the demographic groups most similar to Immigrants from Canada are Celtic (9.8%, a difference of 0.030%), Iranian (9.8%, a difference of 0.11%), Serbian (9.8%, a difference of 0.15%), French Canadian (9.8%, a difference of 0.16%), and Bolivian (9.8%, a difference of 0.21%).
| Demographics | Rating | Rank | Seniors Poverty Over the Age of 65 |
| Filipinos | 99.3 /100 | #52 | Exceptional 9.7% |
| Slavs | 99.2 /100 | #53 | Exceptional 9.8% |
| Immigrants | Northern Europe | 99.2 /100 | #54 | Exceptional 9.8% |
| Afghans | 99.2 /100 | #55 | Exceptional 9.8% |
| Immigrants | England | 99.1 /100 | #56 | Exceptional 9.8% |
| Bolivians | 99.1 /100 | #57 | Exceptional 9.8% |
| Serbians | 99.1 /100 | #58 | Exceptional 9.8% |
| Immigrants | Canada | 99.0 /100 | #59 | Exceptional 9.8% |
| Celtics | 99.0 /100 | #60 | Exceptional 9.8% |
| Iranians | 98.9 /100 | #61 | Exceptional 9.8% |
| French Canadians | 98.9 /100 | #62 | Exceptional 9.8% |
| Macedonians | 98.8 /100 | #63 | Exceptional 9.9% |
| Immigrants | North America | 98.8 /100 | #64 | Exceptional 9.9% |
| Pennsylvania Germans | 98.7 /100 | #65 | Exceptional 9.9% |
| Immigrants | Netherlands | 98.7 /100 | #66 | Exceptional 9.9% |