Laotian vs Bolivian Receiving Food Stamps
COMPARE
Laotian
Bolivian
Receiving Food Stamps
Receiving Food Stamps Comparison
Laotians
Bolivians
10.0%
RECEIVING FOOD STAMPS
98.7/ 100
METRIC RATING
79th/ 347
METRIC RANK
9.3%
RECEIVING FOOD STAMPS
99.7/ 100
METRIC RATING
32nd/ 347
METRIC RANK
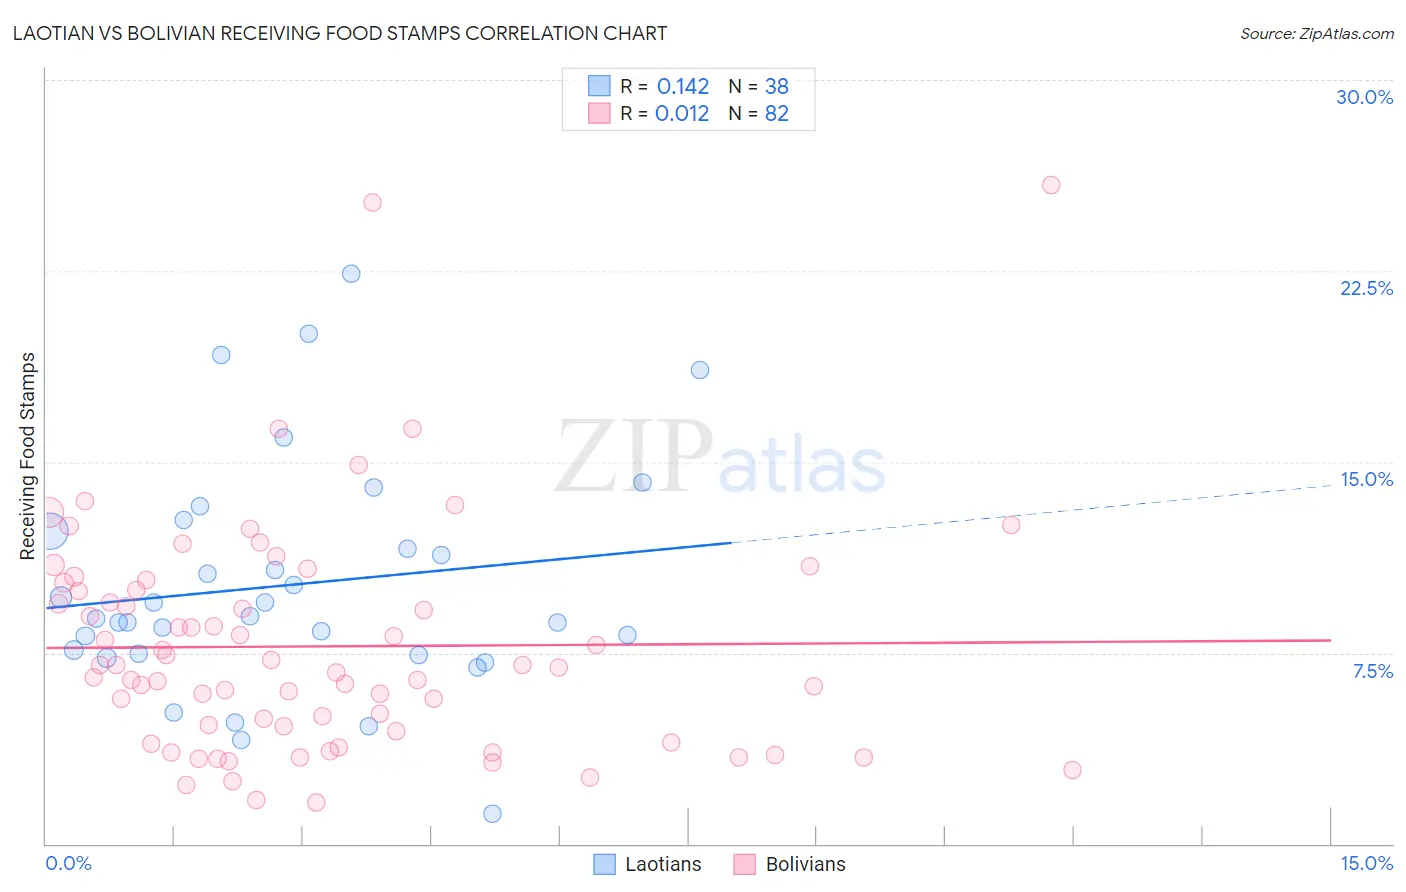
Laotian vs Bolivian Receiving Food Stamps Correlation Chart
The statistical analysis conducted on geographies consisting of 224,502,742 people shows a poor positive correlation between the proportion of Laotians and percentage of population receiving government assistance and/or food stamps in the United States with a correlation coefficient (R) of 0.142 and weighted average of 10.0%. Similarly, the statistical analysis conducted on geographies consisting of 184,439,878 people shows no correlation between the proportion of Bolivians and percentage of population receiving government assistance and/or food stamps in the United States with a correlation coefficient (R) of 0.012 and weighted average of 9.3%, a difference of 6.7%.
Receiving Food Stamps Correlation Summary
| Measurement | Laotian | Bolivian |
| Minimum | 1.2% | 1.6% |
| Maximum | 22.4% | 25.9% |
| Range | 21.2% | 24.3% |
| Mean | 10.2% | 7.8% |
| Median | 8.9% | 7.0% |
| Interquartile 25% (IQ1) | 7.5% | 4.4% |
| Interquartile 75% (IQ3) | 12.3% | 10.0% |
| Interquartile Range (IQR) | 4.8% | 5.6% |
| Standard Deviation (Sample) | 4.5% | 4.5% |
| Standard Deviation (Population) | 4.5% | 4.5% |
Similar Demographics by Receiving Food Stamps
Demographics Similar to Laotians by Receiving Food Stamps
In terms of receiving food stamps, the demographic groups most similar to Laotians are South African (10.0%, a difference of 0.040%), Immigrants from North Macedonia (10.0%, a difference of 0.080%), Polish (10.0%, a difference of 0.080%), Immigrants from Croatia (10.0%, a difference of 0.17%), and Immigrants from Zimbabwe (9.9%, a difference of 0.18%).
| Demographics | Rating | Rank | Receiving Food Stamps |
| Immigrants | Asia | 98.9 /100 | #72 | Exceptional 9.9% |
| Macedonians | 98.9 /100 | #73 | Exceptional 9.9% |
| New Zealanders | 98.8 /100 | #74 | Exceptional 9.9% |
| Immigrants | Zimbabwe | 98.7 /100 | #75 | Exceptional 9.9% |
| Immigrants | Croatia | 98.7 /100 | #76 | Exceptional 10.0% |
| Immigrants | North Macedonia | 98.7 /100 | #77 | Exceptional 10.0% |
| South Africans | 98.7 /100 | #78 | Exceptional 10.0% |
| Laotians | 98.7 /100 | #79 | Exceptional 10.0% |
| Poles | 98.6 /100 | #80 | Exceptional 10.0% |
| Immigrants | England | 98.6 /100 | #81 | Exceptional 10.0% |
| Austrians | 98.6 /100 | #82 | Exceptional 10.0% |
| Dutch | 98.6 /100 | #83 | Exceptional 10.0% |
| Immigrants | Israel | 98.5 /100 | #84 | Exceptional 10.0% |
| Immigrants | Romania | 98.5 /100 | #85 | Exceptional 10.0% |
| Immigrants | Norway | 98.4 /100 | #86 | Exceptional 10.0% |
Demographics Similar to Bolivians by Receiving Food Stamps
In terms of receiving food stamps, the demographic groups most similar to Bolivians are Immigrants from Eastern Asia (9.3%, a difference of 0.31%), Immigrants from Sweden (9.3%, a difference of 0.72%), Immigrants from Lithuania (9.2%, a difference of 1.1%), Czech (9.2%, a difference of 1.4%), and Bhutanese (9.2%, a difference of 1.4%).
| Demographics | Rating | Rank | Receiving Food Stamps |
| Immigrants | Ireland | 99.8 /100 | #25 | Exceptional 9.2% |
| Swedes | 99.8 /100 | #26 | Exceptional 9.2% |
| Bhutanese | 99.8 /100 | #27 | Exceptional 9.2% |
| Czechs | 99.8 /100 | #28 | Exceptional 9.2% |
| Immigrants | Lithuania | 99.8 /100 | #29 | Exceptional 9.2% |
| Immigrants | Sweden | 99.7 /100 | #30 | Exceptional 9.3% |
| Immigrants | Eastern Asia | 99.7 /100 | #31 | Exceptional 9.3% |
| Bolivians | 99.7 /100 | #32 | Exceptional 9.3% |
| Zimbabweans | 99.6 /100 | #33 | Exceptional 9.5% |
| Turks | 99.6 /100 | #34 | Exceptional 9.5% |
| Immigrants | Austria | 99.6 /100 | #35 | Exceptional 9.5% |
| Estonians | 99.6 /100 | #36 | Exceptional 9.5% |
| Europeans | 99.6 /100 | #37 | Exceptional 9.5% |
| Immigrants | Sri Lanka | 99.5 /100 | #38 | Exceptional 9.5% |
| Immigrants | Bolivia | 99.5 /100 | #39 | Exceptional 9.5% |