Laotian vs Pueblo Receiving Food Stamps
COMPARE
Laotian
Pueblo
Receiving Food Stamps
Receiving Food Stamps Comparison
Laotians
Pueblo
10.0%
RECEIVING FOOD STAMPS
98.7/ 100
METRIC RATING
79th/ 347
METRIC RANK
19.9%
RECEIVING FOOD STAMPS
0.0/ 100
METRIC RATING
332nd/ 347
METRIC RANK
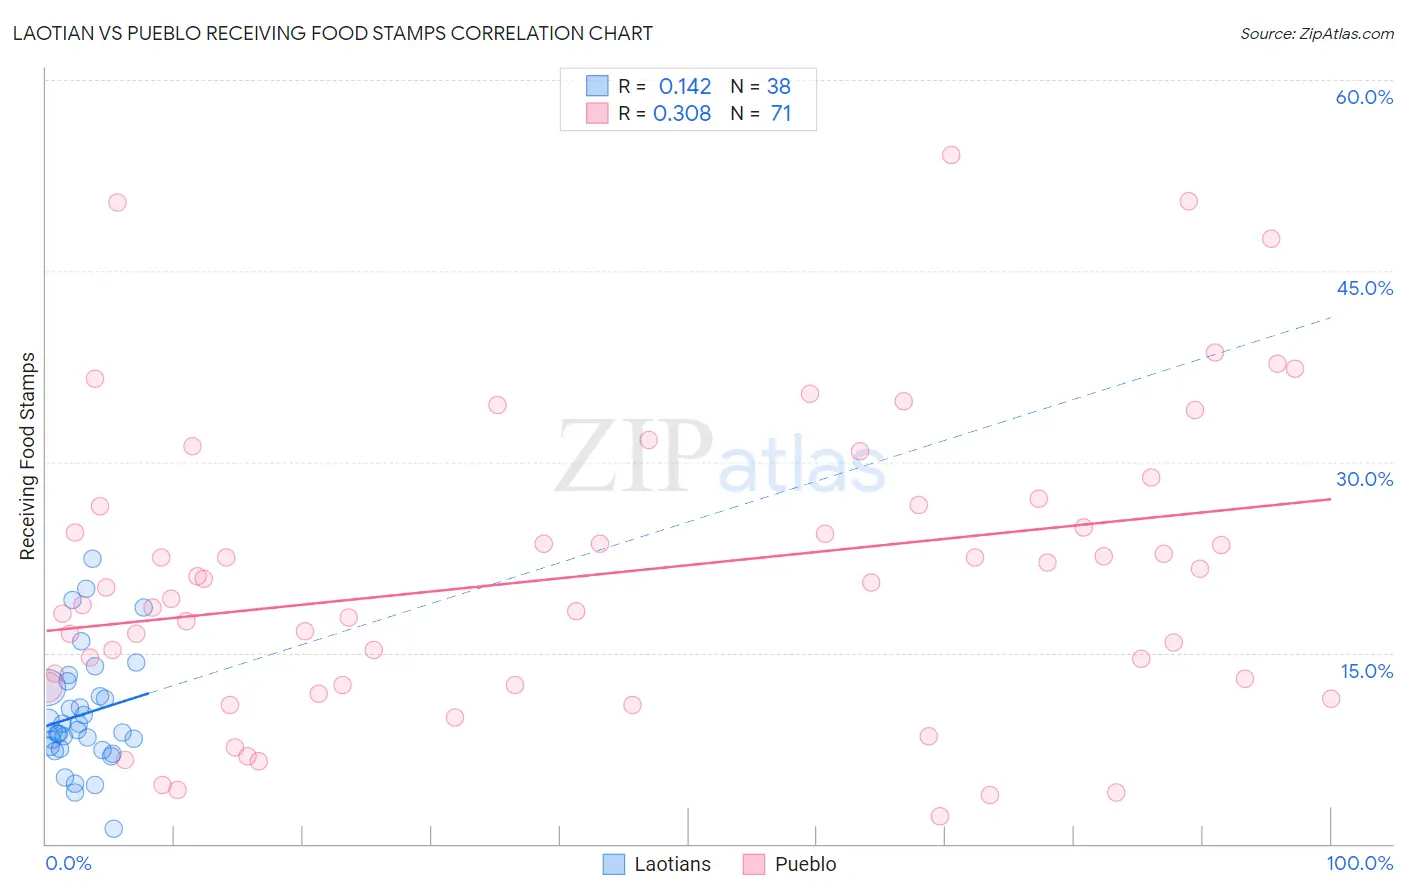
Laotian vs Pueblo Receiving Food Stamps Correlation Chart
The statistical analysis conducted on geographies consisting of 224,502,742 people shows a poor positive correlation between the proportion of Laotians and percentage of population receiving government assistance and/or food stamps in the United States with a correlation coefficient (R) of 0.142 and weighted average of 10.0%. Similarly, the statistical analysis conducted on geographies consisting of 120,026,955 people shows a mild positive correlation between the proportion of Pueblo and percentage of population receiving government assistance and/or food stamps in the United States with a correlation coefficient (R) of 0.308 and weighted average of 19.9%, a difference of 99.7%.
Receiving Food Stamps Correlation Summary
| Measurement | Laotian | Pueblo |
| Minimum | 1.2% | 2.2% |
| Maximum | 22.4% | 54.1% |
| Range | 21.2% | 51.9% |
| Mean | 10.2% | 21.2% |
| Median | 8.9% | 20.2% |
| Interquartile 25% (IQ1) | 7.5% | 12.5% |
| Interquartile 75% (IQ3) | 12.3% | 26.6% |
| Interquartile Range (IQR) | 4.8% | 14.1% |
| Standard Deviation (Sample) | 4.5% | 11.7% |
| Standard Deviation (Population) | 4.5% | 11.6% |
Similar Demographics by Receiving Food Stamps
Demographics Similar to Laotians by Receiving Food Stamps
In terms of receiving food stamps, the demographic groups most similar to Laotians are South African (10.0%, a difference of 0.040%), Immigrants from North Macedonia (10.0%, a difference of 0.080%), Polish (10.0%, a difference of 0.080%), Immigrants from Croatia (10.0%, a difference of 0.17%), and Immigrants from Zimbabwe (9.9%, a difference of 0.18%).
| Demographics | Rating | Rank | Receiving Food Stamps |
| Immigrants | Asia | 98.9 /100 | #72 | Exceptional 9.9% |
| Macedonians | 98.9 /100 | #73 | Exceptional 9.9% |
| New Zealanders | 98.8 /100 | #74 | Exceptional 9.9% |
| Immigrants | Zimbabwe | 98.7 /100 | #75 | Exceptional 9.9% |
| Immigrants | Croatia | 98.7 /100 | #76 | Exceptional 10.0% |
| Immigrants | North Macedonia | 98.7 /100 | #77 | Exceptional 10.0% |
| South Africans | 98.7 /100 | #78 | Exceptional 10.0% |
| Laotians | 98.7 /100 | #79 | Exceptional 10.0% |
| Poles | 98.6 /100 | #80 | Exceptional 10.0% |
| Immigrants | England | 98.6 /100 | #81 | Exceptional 10.0% |
| Austrians | 98.6 /100 | #82 | Exceptional 10.0% |
| Dutch | 98.6 /100 | #83 | Exceptional 10.0% |
| Immigrants | Israel | 98.5 /100 | #84 | Exceptional 10.0% |
| Immigrants | Romania | 98.5 /100 | #85 | Exceptional 10.0% |
| Immigrants | Norway | 98.4 /100 | #86 | Exceptional 10.0% |
Demographics Similar to Pueblo by Receiving Food Stamps
In terms of receiving food stamps, the demographic groups most similar to Pueblo are Inupiat (20.1%, a difference of 0.73%), Immigrants from Caribbean (19.6%, a difference of 1.5%), Yuman (20.2%, a difference of 1.6%), Immigrants from Cuba (20.8%, a difference of 4.6%), and Pima (19.0%, a difference of 5.0%).
| Demographics | Rating | Rank | Receiving Food Stamps |
| Immigrants | Haiti | 0.0 /100 | #325 | Tragic 18.2% |
| Cubans | 0.0 /100 | #326 | Tragic 18.2% |
| Apache | 0.0 /100 | #327 | Tragic 18.3% |
| Colville | 0.0 /100 | #328 | Tragic 18.3% |
| Immigrants | Dominica | 0.0 /100 | #329 | Tragic 18.4% |
| Pima | 0.0 /100 | #330 | Tragic 19.0% |
| Immigrants | Caribbean | 0.0 /100 | #331 | Tragic 19.6% |
| Pueblo | 0.0 /100 | #332 | Tragic 19.9% |
| Inupiat | 0.0 /100 | #333 | Tragic 20.1% |
| Yuman | 0.0 /100 | #334 | Tragic 20.2% |
| Immigrants | Cuba | 0.0 /100 | #335 | Tragic 20.8% |
| Navajo | 0.0 /100 | #336 | Tragic 21.1% |
| Cape Verdeans | 0.0 /100 | #337 | Tragic 21.1% |
| Dominicans | 0.0 /100 | #338 | Tragic 21.4% |
| Yakama | 0.0 /100 | #339 | Tragic 21.4% |