Colville vs Bolivian Receiving Food Stamps
COMPARE
Colville
Bolivian
Receiving Food Stamps
Receiving Food Stamps Comparison
Colville
Bolivians
18.3%
RECEIVING FOOD STAMPS
0.0/ 100
METRIC RATING
328th/ 347
METRIC RANK
9.3%
RECEIVING FOOD STAMPS
99.7/ 100
METRIC RATING
32nd/ 347
METRIC RANK
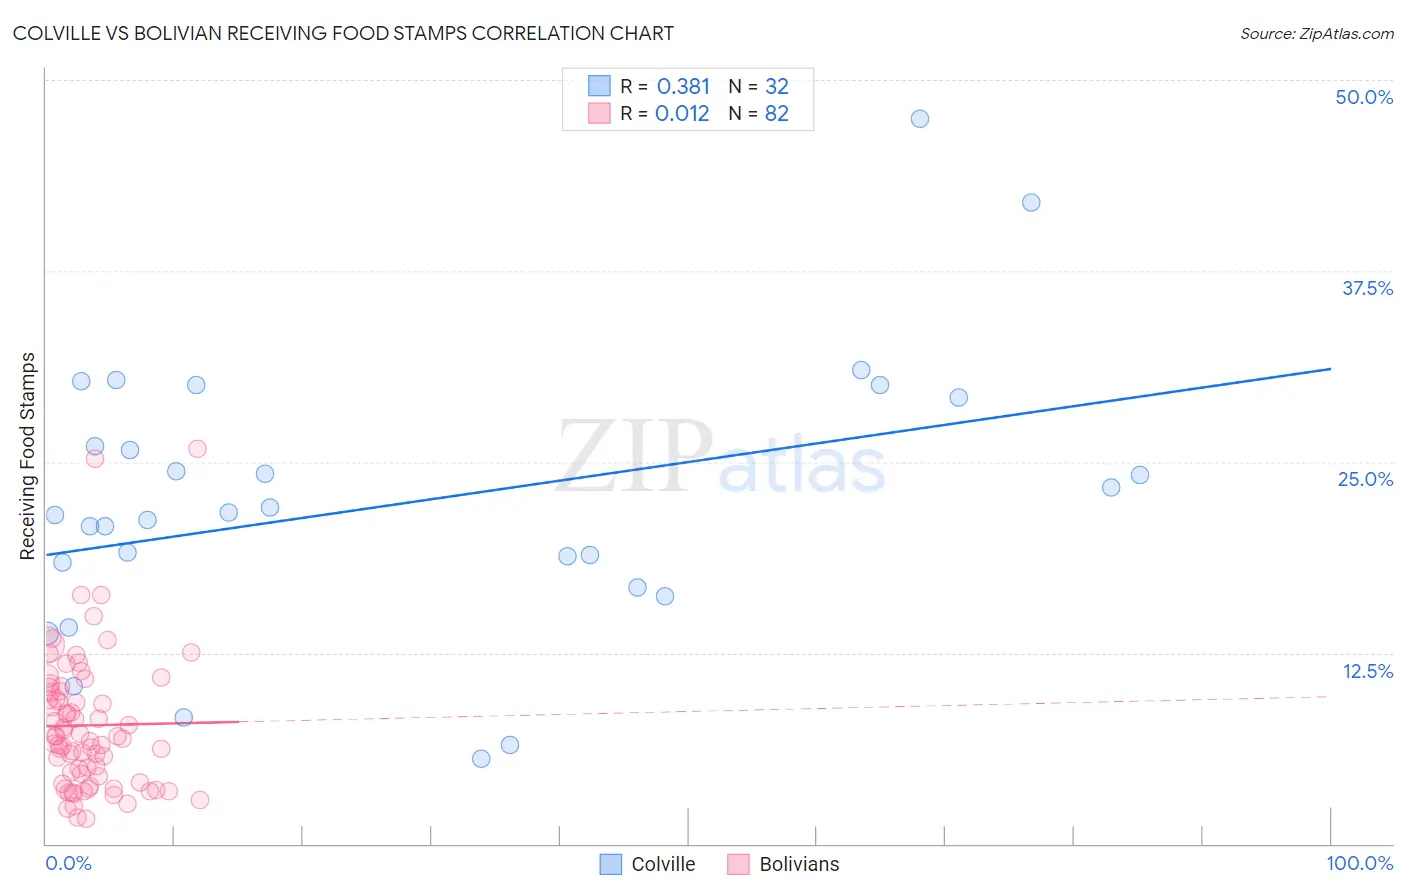
Colville vs Bolivian Receiving Food Stamps Correlation Chart
The statistical analysis conducted on geographies consisting of 34,677,374 people shows a mild positive correlation between the proportion of Colville and percentage of population receiving government assistance and/or food stamps in the United States with a correlation coefficient (R) of 0.381 and weighted average of 18.3%. Similarly, the statistical analysis conducted on geographies consisting of 184,439,878 people shows no correlation between the proportion of Bolivians and percentage of population receiving government assistance and/or food stamps in the United States with a correlation coefficient (R) of 0.012 and weighted average of 9.3%, a difference of 96.0%.
Receiving Food Stamps Correlation Summary
| Measurement | Colville | Bolivian |
| Minimum | 5.6% | 1.6% |
| Maximum | 47.5% | 25.9% |
| Range | 41.9% | 24.3% |
| Mean | 22.3% | 7.8% |
| Median | 21.6% | 7.0% |
| Interquartile 25% (IQ1) | 17.6% | 4.4% |
| Interquartile 75% (IQ3) | 27.6% | 10.0% |
| Interquartile Range (IQR) | 10.0% | 5.6% |
| Standard Deviation (Sample) | 9.1% | 4.5% |
| Standard Deviation (Population) | 8.9% | 4.5% |
Similar Demographics by Receiving Food Stamps
Demographics Similar to Colville by Receiving Food Stamps
In terms of receiving food stamps, the demographic groups most similar to Colville are Apache (18.3%, a difference of 0.21%), Immigrants from Dominica (18.4%, a difference of 0.46%), Cuban (18.2%, a difference of 0.52%), Immigrants from Haiti (18.2%, a difference of 0.63%), and British West Indian (17.9%, a difference of 2.4%).
| Demographics | Rating | Rank | Receiving Food Stamps |
| Natives/Alaskans | 0.0 /100 | #321 | Tragic 17.3% |
| Immigrants | Grenada | 0.0 /100 | #322 | Tragic 17.8% |
| Haitians | 0.0 /100 | #323 | Tragic 17.8% |
| British West Indians | 0.0 /100 | #324 | Tragic 17.9% |
| Immigrants | Haiti | 0.0 /100 | #325 | Tragic 18.2% |
| Cubans | 0.0 /100 | #326 | Tragic 18.2% |
| Apache | 0.0 /100 | #327 | Tragic 18.3% |
| Colville | 0.0 /100 | #328 | Tragic 18.3% |
| Immigrants | Dominica | 0.0 /100 | #329 | Tragic 18.4% |
| Pima | 0.0 /100 | #330 | Tragic 19.0% |
| Immigrants | Caribbean | 0.0 /100 | #331 | Tragic 19.6% |
| Pueblo | 0.0 /100 | #332 | Tragic 19.9% |
| Inupiat | 0.0 /100 | #333 | Tragic 20.1% |
| Yuman | 0.0 /100 | #334 | Tragic 20.2% |
| Immigrants | Cuba | 0.0 /100 | #335 | Tragic 20.8% |
Demographics Similar to Bolivians by Receiving Food Stamps
In terms of receiving food stamps, the demographic groups most similar to Bolivians are Immigrants from Eastern Asia (9.3%, a difference of 0.31%), Immigrants from Sweden (9.3%, a difference of 0.72%), Immigrants from Lithuania (9.2%, a difference of 1.1%), Czech (9.2%, a difference of 1.4%), and Bhutanese (9.2%, a difference of 1.4%).
| Demographics | Rating | Rank | Receiving Food Stamps |
| Immigrants | Ireland | 99.8 /100 | #25 | Exceptional 9.2% |
| Swedes | 99.8 /100 | #26 | Exceptional 9.2% |
| Bhutanese | 99.8 /100 | #27 | Exceptional 9.2% |
| Czechs | 99.8 /100 | #28 | Exceptional 9.2% |
| Immigrants | Lithuania | 99.8 /100 | #29 | Exceptional 9.2% |
| Immigrants | Sweden | 99.7 /100 | #30 | Exceptional 9.3% |
| Immigrants | Eastern Asia | 99.7 /100 | #31 | Exceptional 9.3% |
| Bolivians | 99.7 /100 | #32 | Exceptional 9.3% |
| Zimbabweans | 99.6 /100 | #33 | Exceptional 9.5% |
| Turks | 99.6 /100 | #34 | Exceptional 9.5% |
| Immigrants | Austria | 99.6 /100 | #35 | Exceptional 9.5% |
| Estonians | 99.6 /100 | #36 | Exceptional 9.5% |
| Europeans | 99.6 /100 | #37 | Exceptional 9.5% |
| Immigrants | Sri Lanka | 99.5 /100 | #38 | Exceptional 9.5% |
| Immigrants | Bolivia | 99.5 /100 | #39 | Exceptional 9.5% |