Kiowa vs Colville Female Poverty Among 25-34 Year Olds
COMPARE
Kiowa
Colville
Female Poverty Among 25-34 Year Olds
Female Poverty Among 25-34 Year Olds Comparison
Kiowa
Colville
19.7%
FEMALE POVERTY AMONG 25-34 YEAR OLDS
0.0/ 100
METRIC RATING
331st/ 347
METRIC RANK
17.5%
FEMALE POVERTY AMONG 25-34 YEAR OLDS
0.0/ 100
METRIC RATING
313th/ 347
METRIC RANK
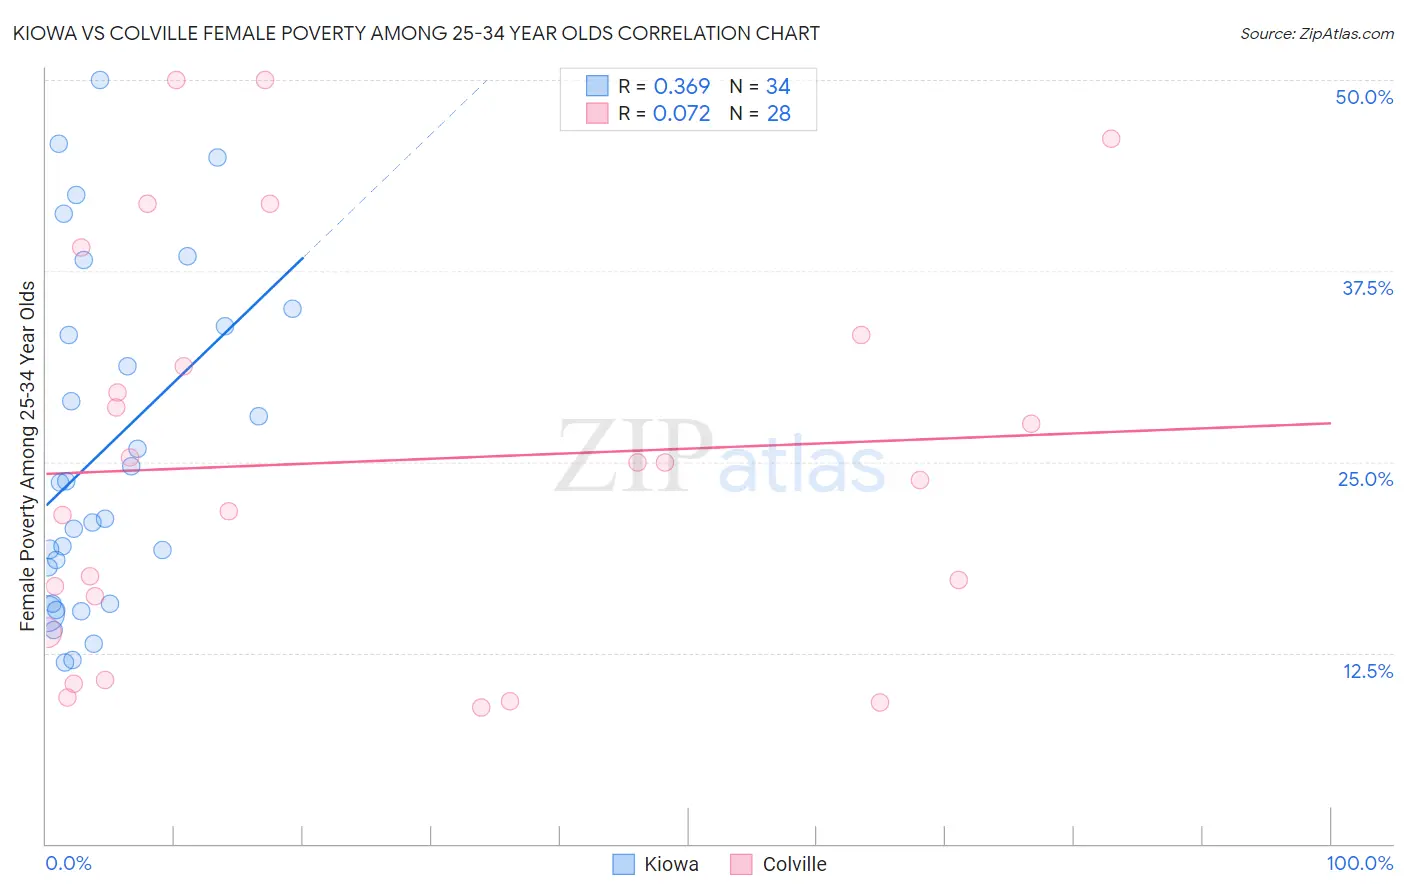
Kiowa vs Colville Female Poverty Among 25-34 Year Olds Correlation Chart
The statistical analysis conducted on geographies consisting of 56,020,339 people shows a mild positive correlation between the proportion of Kiowa and poverty level among females between the ages 25 and 34 in the United States with a correlation coefficient (R) of 0.369 and weighted average of 19.7%. Similarly, the statistical analysis conducted on geographies consisting of 34,614,796 people shows a slight positive correlation between the proportion of Colville and poverty level among females between the ages 25 and 34 in the United States with a correlation coefficient (R) of 0.072 and weighted average of 17.5%, a difference of 12.6%.
Female Poverty Among 25-34 Year Olds Correlation Summary
| Measurement | Kiowa | Colville |
| Minimum | 11.9% | 8.9% |
| Maximum | 50.0% | 50.0% |
| Range | 38.1% | 41.1% |
| Mean | 25.7% | 25.1% |
| Median | 22.5% | 24.4% |
| Interquartile 25% (IQ1) | 15.7% | 15.0% |
| Interquartile 75% (IQ3) | 33.8% | 32.3% |
| Interquartile Range (IQR) | 18.1% | 17.3% |
| Standard Deviation (Sample) | 11.0% | 12.8% |
| Standard Deviation (Population) | 10.8% | 12.6% |
Demographics Similar to Kiowa and Colville by Female Poverty Among 25-34 Year Olds
In terms of female poverty among 25-34 year olds, the demographic groups most similar to Kiowa are Paiute (19.6%, a difference of 0.42%), Immigrants from Yemen (19.8%, a difference of 0.59%), Creek (19.2%, a difference of 2.7%), Alaskan Athabascan (19.1%, a difference of 2.9%), and Cheyenne (19.1%, a difference of 3.0%). Similarly, the demographic groups most similar to Colville are Iroquois (17.5%, a difference of 0.080%), Immigrants from Dominican Republic (17.6%, a difference of 0.68%), Yakama (17.6%, a difference of 0.90%), Dominican (17.6%, a difference of 0.90%), and Arapaho (17.8%, a difference of 1.7%).
| Demographics | Rating | Rank | Female Poverty Among 25-34 Year Olds |
| Iroquois | 0.0 /100 | #312 | Tragic 17.5% |
| Colville | 0.0 /100 | #313 | Tragic 17.5% |
| Immigrants | Dominican Republic | 0.0 /100 | #314 | Tragic 17.6% |
| Yakama | 0.0 /100 | #315 | Tragic 17.6% |
| Dominicans | 0.0 /100 | #316 | Tragic 17.6% |
| Arapaho | 0.0 /100 | #317 | Tragic 17.8% |
| Ute | 0.0 /100 | #318 | Tragic 17.9% |
| Menominee | 0.0 /100 | #319 | Tragic 18.0% |
| Chippewa | 0.0 /100 | #320 | Tragic 18.0% |
| Choctaw | 0.0 /100 | #321 | Tragic 18.1% |
| Central American Indians | 0.0 /100 | #322 | Tragic 18.2% |
| Seminole | 0.0 /100 | #323 | Tragic 18.3% |
| Dutch West Indians | 0.0 /100 | #324 | Tragic 18.4% |
| Inupiat | 0.0 /100 | #325 | Tragic 18.5% |
| Blacks/African Americans | 0.0 /100 | #326 | Tragic 18.9% |
| Cheyenne | 0.0 /100 | #327 | Tragic 19.1% |
| Alaskan Athabascans | 0.0 /100 | #328 | Tragic 19.1% |
| Creek | 0.0 /100 | #329 | Tragic 19.2% |
| Paiute | 0.0 /100 | #330 | Tragic 19.6% |
| Kiowa | 0.0 /100 | #331 | Tragic 19.7% |
| Immigrants | Yemen | 0.0 /100 | #332 | Tragic 19.8% |