Immigrants from Canada vs Immigrants from Nicaragua Seniors Poverty Over the Age of 75
COMPARE
Immigrants from Canada
Immigrants from Nicaragua
Seniors Poverty Over the Age of 75
Seniors Poverty Over the Age of 75 Comparison
Immigrants from Canada
Immigrants from Nicaragua
11.2%
SENIORS POVERTY OVER THE AGE OF 75
97.9/ 100
METRIC RATING
57th/ 347
METRIC RANK
17.6%
SENIORS POVERTY OVER THE AGE OF 75
0.0/ 100
METRIC RATING
333rd/ 347
METRIC RANK
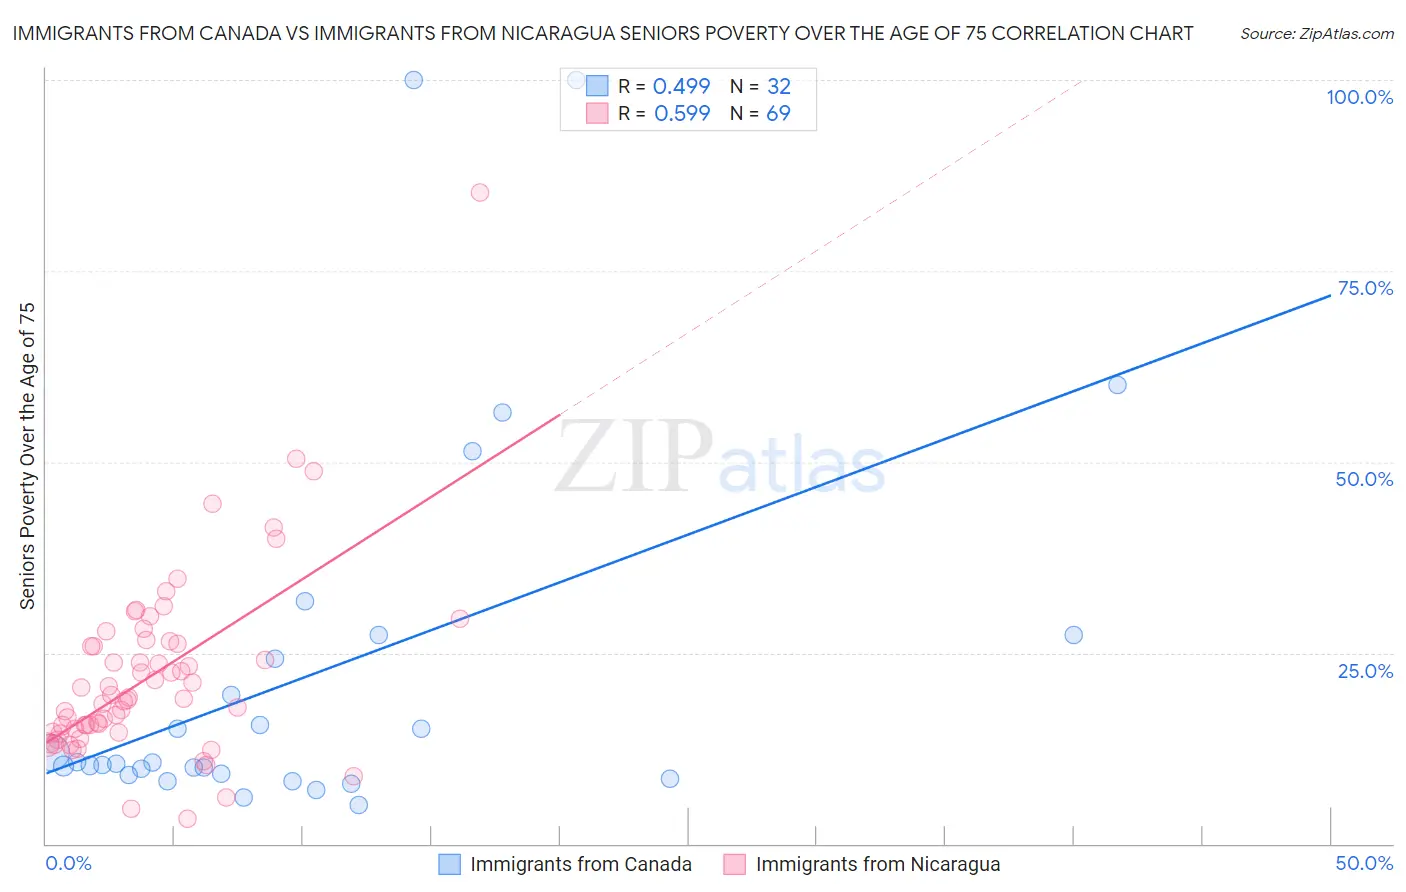
Immigrants from Canada vs Immigrants from Nicaragua Seniors Poverty Over the Age of 75 Correlation Chart
The statistical analysis conducted on geographies consisting of 452,026,685 people shows a moderate positive correlation between the proportion of Immigrants from Canada and poverty level among seniors over the age of 75 in the United States with a correlation coefficient (R) of 0.499 and weighted average of 11.2%. Similarly, the statistical analysis conducted on geographies consisting of 235,301,919 people shows a substantial positive correlation between the proportion of Immigrants from Nicaragua and poverty level among seniors over the age of 75 in the United States with a correlation coefficient (R) of 0.599 and weighted average of 17.6%, a difference of 56.5%.
Seniors Poverty Over the Age of 75 Correlation Summary
| Measurement | Immigrants from Canada | Immigrants from Nicaragua |
| Minimum | 5.0% | 3.3% |
| Maximum | 100.0% | 85.2% |
| Range | 95.0% | 82.0% |
| Mean | 22.4% | 22.0% |
| Median | 10.5% | 19.0% |
| Interquartile 25% (IQ1) | 9.1% | 14.6% |
| Interquartile 75% (IQ3) | 25.8% | 26.3% |
| Interquartile Range (IQR) | 16.7% | 11.7% |
| Standard Deviation (Sample) | 24.9% | 12.3% |
| Standard Deviation (Population) | 24.5% | 12.2% |
Similar Demographics by Seniors Poverty Over the Age of 75
Demographics Similar to Immigrants from Canada by Seniors Poverty Over the Age of 75
In terms of seniors poverty over the age of 75, the demographic groups most similar to Immigrants from Canada are Yugoslavian (11.2%, a difference of 0.040%), Immigrants from Netherlands (11.2%, a difference of 0.12%), Slavic (11.2%, a difference of 0.23%), Eastern European (11.3%, a difference of 0.23%), and Hungarian (11.2%, a difference of 0.24%).
| Demographics | Rating | Rank | Seniors Poverty Over the Age of 75 |
| Serbians | 98.6 /100 | #50 | Exceptional 11.1% |
| Immigrants | North Macedonia | 98.6 /100 | #51 | Exceptional 11.1% |
| Zimbabweans | 98.5 /100 | #52 | Exceptional 11.2% |
| Immigrants | England | 98.4 /100 | #53 | Exceptional 11.2% |
| Afghans | 98.2 /100 | #54 | Exceptional 11.2% |
| Hungarians | 98.1 /100 | #55 | Exceptional 11.2% |
| Slavs | 98.1 /100 | #56 | Exceptional 11.2% |
| Immigrants | Canada | 97.9 /100 | #57 | Exceptional 11.2% |
| Yugoslavians | 97.9 /100 | #58 | Exceptional 11.2% |
| Immigrants | Netherlands | 97.8 /100 | #59 | Exceptional 11.2% |
| Eastern Europeans | 97.7 /100 | #60 | Exceptional 11.3% |
| Canadians | 97.7 /100 | #61 | Exceptional 11.3% |
| Immigrants | North America | 97.6 /100 | #62 | Exceptional 11.3% |
| Immigrants | Afghanistan | 97.5 /100 | #63 | Exceptional 11.3% |
| Immigrants | Northern Europe | 97.4 /100 | #64 | Exceptional 11.3% |
Demographics Similar to Immigrants from Nicaragua by Seniors Poverty Over the Age of 75
In terms of seniors poverty over the age of 75, the demographic groups most similar to Immigrants from Nicaragua are Immigrants from St. Vincent and the Grenadines (17.5%, a difference of 0.47%), Immigrants from Armenia (17.5%, a difference of 0.74%), British West Indian (17.4%, a difference of 0.99%), Immigrants from Grenada (17.8%, a difference of 1.5%), and Cuban (18.0%, a difference of 2.1%).
| Demographics | Rating | Rank | Seniors Poverty Over the Age of 75 |
| Pueblo | 0.0 /100 | #326 | Tragic 16.7% |
| Sioux | 0.0 /100 | #327 | Tragic 16.8% |
| Cape Verdeans | 0.0 /100 | #328 | Tragic 16.8% |
| Immigrants | Dominica | 0.0 /100 | #329 | Tragic 17.0% |
| British West Indians | 0.0 /100 | #330 | Tragic 17.4% |
| Immigrants | Armenia | 0.0 /100 | #331 | Tragic 17.5% |
| Immigrants | St. Vincent and the Grenadines | 0.0 /100 | #332 | Tragic 17.5% |
| Immigrants | Nicaragua | 0.0 /100 | #333 | Tragic 17.6% |
| Immigrants | Grenada | 0.0 /100 | #334 | Tragic 17.8% |
| Cubans | 0.0 /100 | #335 | Tragic 18.0% |
| Immigrants | Caribbean | 0.0 /100 | #336 | Tragic 18.2% |
| Yakama | 0.0 /100 | #337 | Tragic 18.3% |
| Immigrants | Cabo Verde | 0.0 /100 | #338 | Tragic 18.5% |
| Hopi | 0.0 /100 | #339 | Tragic 18.9% |
| Tohono O'odham | 0.0 /100 | #340 | Tragic 19.1% |